3.0 KiB
React Native WebView Debugging Guide
Here are some helpful React Native WebView debugging tips.
Script Errors
It can be difficult to debug syntax errors and other script errors in WebView, since errors don't show up in a console by default.
One option (if you're loading HTML from an external source) is to inject an error handler before the content is loaded.
<WebView
  injectedJavaScriptBeforeContentLoaded={`
    window.onerror = function(message, sourcefile, lineno, colno, error) {
      alert("Message: " + message + " - Source: " + sourcefile + " Line: " + lineno + ":" + colno);
      return true;
    };
    true;
  `}
  source={{
    uri:
      'https://bl.ocks.org/jamonholmgren/raw/48423fd99537283beace1daa2688e80f/',
  }}
/>
This will provide an Alert box with (hopefully) useful debugging information.
If you're injecting JavaScript, this may fail with Script error and no other useful information. One simple way to debug this is to wrap your injected JavaScript in a try/catch, like so:
const js = `
  try {
    // your code here
  } catch(e) {
    alert(e)
  }
  true;
`;
This will bring up an alert with the error message, which may or may not be helpful.
If these two simple methods fail to uncover the bug, try using the next technique!
Debugging WebView Contents
iOS & Safari
It's possible to debug WebView contents in the iOS simulator or on a device using Safari Developer Toolkit.
Steps:
- Open Safari Preferences -> "Advanced" tab -> enable checkbox "Show Develop menu in menu bar"
- Start app with React Native WebView in iOS simulator or iOS device
- Safari -> Develop -> [device name] -> [app name] -> [url - title]
- You can now debug the WebView contents just as you would on the web
Notes:
When debugging on device you must enable Web Inspector in your device settings:
Settings -> Safari -> Advanced -> Web Inspector
Also, if you don't see your device in the Develop menu, and you started Safari before you started your simulator, try restarting Safari.
Android & Chrome
It's possible to debug WebView contents in the Android emulator or on a device using Chrome DevTools.
- You will need to make the following change to
MainApplication.javato enabled web contents debugging:
  import android.webkit.WebView;

  @Override
  public void onCreate() {
    super.onCreate();
	  ...
    WebView.setWebContentsDebuggingEnabled(true);
  }
- Start app with React Native WebView in Android emulator or Android device
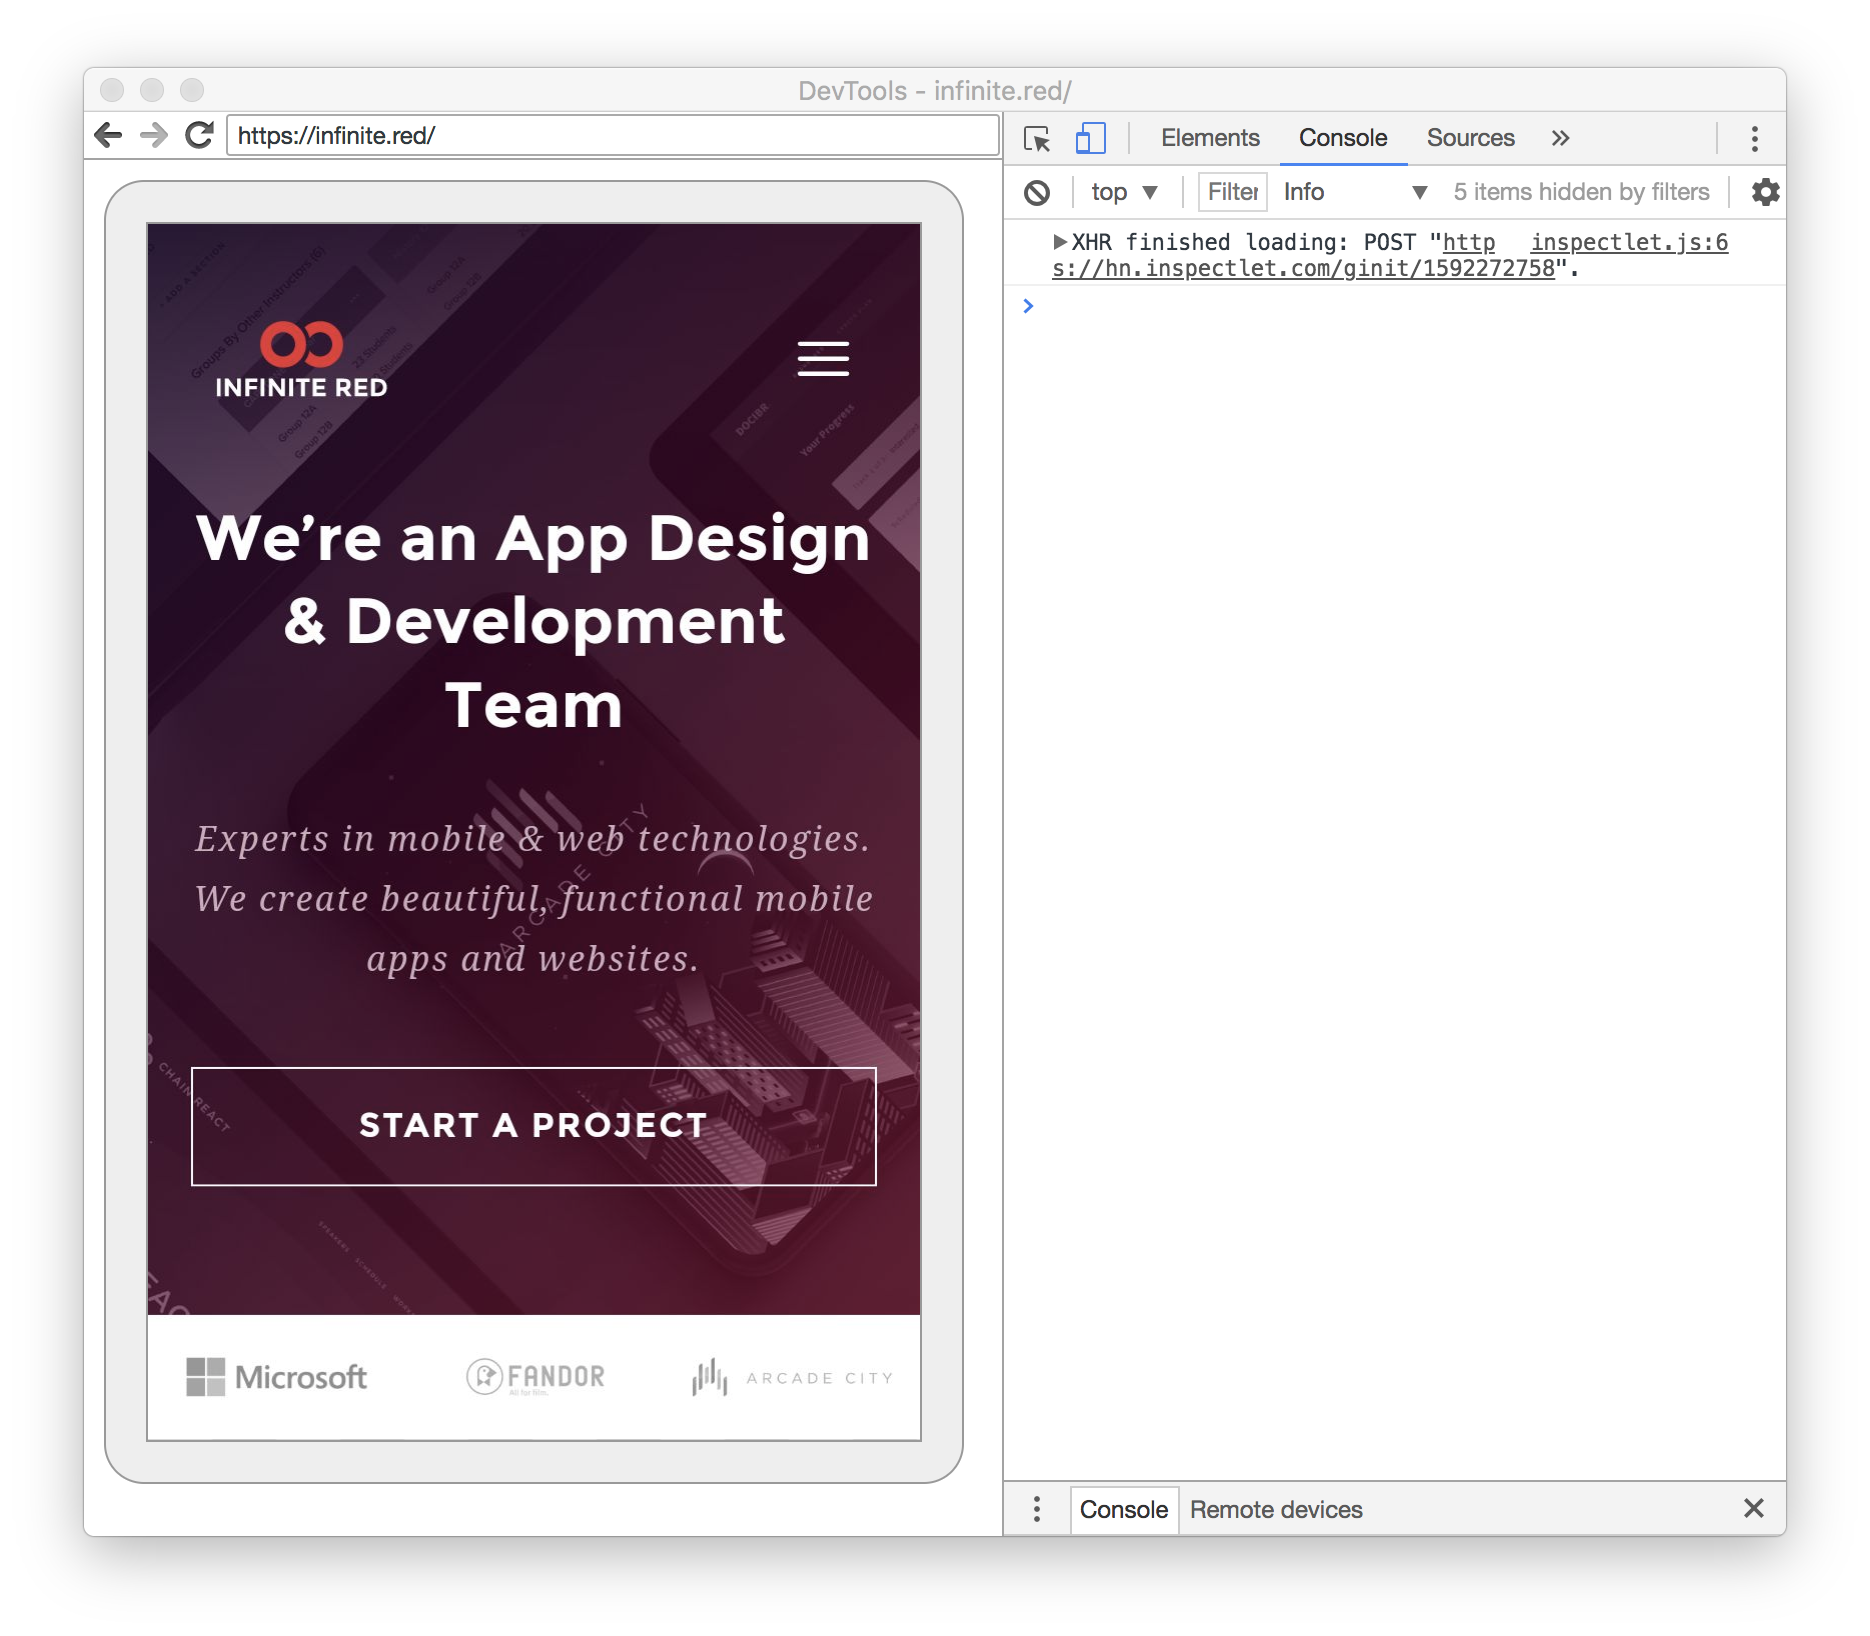
- Chrome -> DevTools -> Menu (3 dots) -> More tools -> Remote devices
- Select your device on the left and select "Inspect" on the WebView contents you'd like to inspect
- You can now debug the WebView contents just as you would on the web
Note:
When debugging on device you must enable USB debugging in your device settings:
Settings -> System -> About Phone -> Developer options -> enable USB debugging