re-frame-trace
re-frame-trace is a programmer's dashboard
for inspecting a running re-frame application. It should assist you to both understand and debug your application.
Note the latest version 0.1.14 ALSO requires the latest version of re-frame itself - v0.10.3-alpha2.
Dashboard Overview
re-frame applications are computationally regular. First an event happens,
and then boom, boom, boom go a series of known steps (dominos), in a known order. At the end of
it, a re-frame app lapses into a quiescent state waiting for another event to kick
off the next iteration of the same cycle.
Each re-frame event and its consequent computation forms a discrete "epoch" which can be analysed and inspected independently of other epochs. As a result, this tool is epoch-oriented.
As it runs, re-frame generates detailed "trace data", but much of it will be low level and uninteresting a lot of the time.
re-frame-trace is a "dashboard" in the sense that it shows useful, "rolled up" information "at a glance", and allows you to drill down and explore the detail as necessary. All the data you want should ultimately be available, but you shouldn't initially drown in it.
Not only is the underlying trace "just data", but so is much of the observed re-frame proecess. Much of what re-frame does on your behalf is the move data from one domino to another. You write the dominos (functions) and re-frame will flow data through them.
So, yeah, this tool an epoch-oriented, interactive data dashboard for gaining insights and assisting debugging. It is also a work in progress, so this grand descrption runs well ahead of what is delivered right now.
More Aspirational goals
Here's the vision for how we'd like re-frame-trace to help (eventually):
- Help in learning
re-frame. If I'm new tore-frame, the dashboard should assist me to understand the dominoes and the data flows involved. - Help in learning a new code base. It should help me to explore how an unfamiliar application is wired together. When I click
on this button "X", it shows me what event is
dispatch-ed and in what namespace the associated event handler is registered. And, "oh look, that's interesting - four subscriptions recalculated". Etc. - Help with debugging. Particularly assistance for writing event handlers as they hold most of the application logic.
- Help with finding performance problems and/or detecting where there is unnecessary computation occuring.
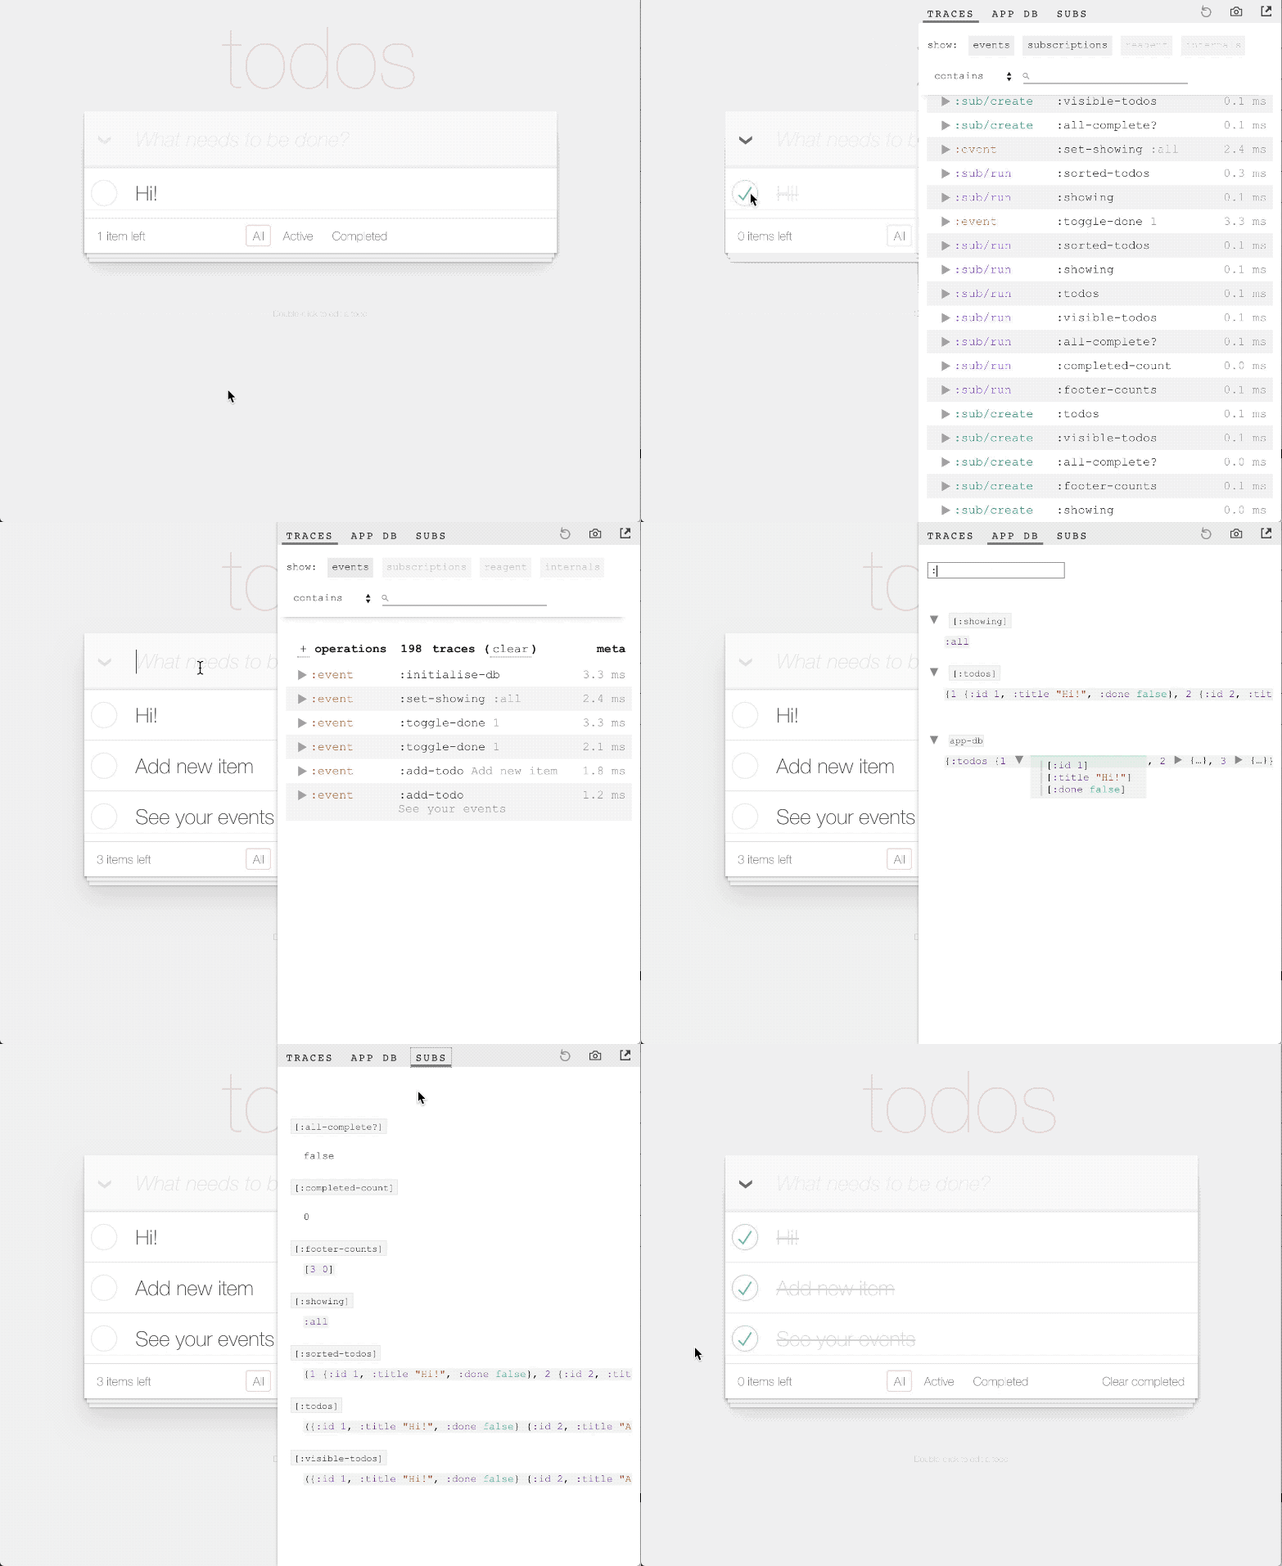
A Visual Sampler

Installation
If you are using leiningen, modify project.clj in the following ways. When puzzling over the various possible leiningen configurations, it's often helpful to look at a sample project.clj.
-
Add re-frame-trace as a dev dependency by placing
[day8.re-frame/trace "VERSION"]within:profiles :dev :dependencies. For example::profiles {:dev {:dependencies [[some-other-package "0.0.0"] [day8.re-frame/trace "0.0.0 (see version above)"]] }} -
Locate the
:compilermap under:devand add::closure-defines {"re_frame.trace.trace_enabled_QMARK_" true}:preloads [day8.re-frame.trace.preload]
For example:
{:builds
   [{:id           "dev"
     :source-paths ["src" "dev"]
     :compiler     {...
                    :closure-defines      {"re_frame.trace.trace_enabled_QMARK_" true}
                    :preloads             [day8.re-frame.trace.preload]}}]}
cljs-devtools is not required to use re-frame-trace, but it is highly recommended.
Usage
-
Make sure you have followed all of the installation instructions above.
-
Start up your application.
-
Once it is loaded, focus the document window and press
ctrl-hto slide open the trace panel and enable tracing. -
When the panel is closed, tracing is disabled.
Troubleshooting
- Try a
lein clean - Make sure you have followed all the installation steps.
How does it work?
re-frame is instrumented - all important activity generates trace data. re-frame-trace consumes this trace data and renders useful visualisations of the re-frame process. Currently, re-frame's tracing capabilities are in alpha and are subject to change at any time. We're testing the utility of the the trace by building an app on top.
By default, re-frame tracing is "compiled out", so it won't impose a performance cost in production. The trade-off here is that you need to explicitly enable it in development.
The preloads option (:preloads [day8.re-frame.trace.preload]) has to be set in order to automatically monkeypatch Reagent to add appropriate lifecycle hooks. Yes this is gross, and yes we will try and make a PR to reagent to add proper hooks, once we know exactly what we need. The preload namespace also injects a div containing the devtools panel into the DOM.
Developing/Contributing
If you want to work on re-frame-trace, see DEVELOPERS.md.
Citations
- open by Bluetip Design from the Noun Project
- reload by Adnen Kadri from the Noun Project
- Camera by Christian Shannon from the Noun Project
- Delete by logan from the Noun Project
- Settings by arjuazka from the Noun Project
- Wrench by Aleksandr Vector from the Noun Project
- pause by Bhuvan from the Noun Project
- play by Bhuvan from the Noun Project
- Log Out by Arthur Shlain from the Noun Project
