13 KiB
| title | description |
|---|---|
| PostgreSQL | Document that describes why Nim-Waku started to use Postgres and shows some benchmark and comparison results. |
Introduction
The Nim Waku Node, nwaku, has the capability of archiving messages until a certain limit (e.g. 30 days) so that other nodes can synchronize their message history throughout the Store protocol.
The nwaku originally used SQLite to archive messages but this has an impact on the node. Nwaku is single-threaded and therefore, any SQLite operation impacts the performance of other protocols, like Relay.
Therefore, the Postgres adoption is needed to enhance that.
https://github.com/waku-org/nwaku/issues/1888
How to connect the nwaku to Postgres
Simply pass the next parameter to nwaku
--store-message-db-url="postgres://${POSTGRES_USER}:${POSTGRES_PASSWORD}@${POSTGRES_HOST}:${POSTGRES_PORT}/postgres
Notice that this only makes sense if the nwaku has the Store protocol mounted
--store=true
(start the nwaku node with --help parameter for more Store options)
Examples of nwaku using Postgres
https://github.com/waku-org/nwaku-compose
https://github.com/waku-org/test-waku-query
Stress tests
The following repository was created as a tool to stress and compare performance between nwaku+Postgres and nwaku+SQLite:
https://github.com/waku-org/test-waku-query
Insert test results
Maximum insert throughput
Scenario
- 1 node subscribed to pubsubtopic ‘x’ and the Store protocol mounted.
- ‘n’ nodes connected to the “store” node, and publishing messages simultaneously to pubsubtopic ‘x’.
- All nodes running locally in a Dell Latitude 7640.
- Each published message is fixed, 1.4 KB: publish_one_client.sh
- The next script is used to simulate multiple nodes publishing messages: publish_multiple_clients.sh
Sought goal
Find out the maximum number of concurrent inserts that both SQLite and Postgres could support, and check whether Postgres behaves better than SQLite or not.
Conclusion
Messages are lost after a certain threshold, and this message loss is due to limitations in the Relay protocol (GossipSub - libp2p.)
For example, if we set 30 nodes publishing 300 messages simultaneously, then 8997 rows were stored and not the expected 9000, in both SQLite and Postgres databases.
The reason why few messages were lost is because the message rate was higher than the relay protocol can support, and therefore a few messages were not stored. In this example, the test took 38.8’’, and therefore, the node was receiving 232 msgs/sec, which is much more than the normal rate a node will work with, which is ~10 msgs/sec (rate extracted from Grafana’s stats for the status.prod fleet.)
As a conclusion, the bottleneck is within the Relay protocol itself and not the underlying databases. Or, in other words, both SQLite and Postgres can support the maximum insert rate a Waku node will operate within normal conditions.
Query test results (jmeter)
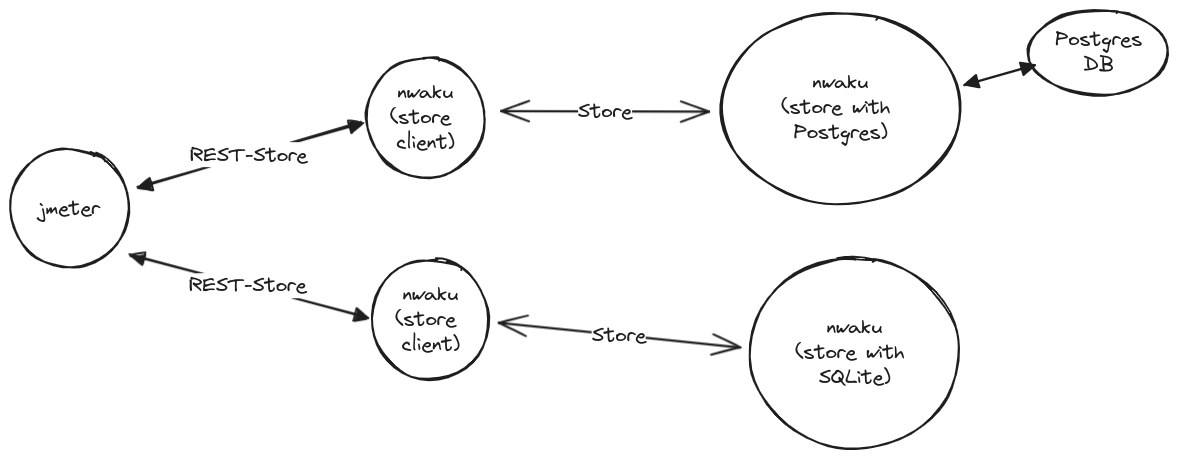
In this case, we are comparing Store performance by means of Rest service.
Scenario
- node_a: one nwaku node with Store and connected to Postgres.
- node_b: one nwaku node with Store and using SQLite.
- Both Postgres and SQLite contain +1 million rows.
- node_c: one nwaku node with REST enabled and acting as a Store client for node_a.
- node_d: one nwaku node with REST enabled and acting as a Store client for node_b.
- With jmeter, 10 users make REST Store requests concurrently to each of the “rest” nodes (node_c and node_d.)
- All nwaku nodes running statusteam/nim-waku:v0.19.0
This is the jmeter project used.
Results
With this, the node_b brings a higher throughput than the node_a and that indicates that the node that uses SQLite performs better. The following shows the measures taken by jmeter with regard to the REST requests.
Query test results (only Store protocol)
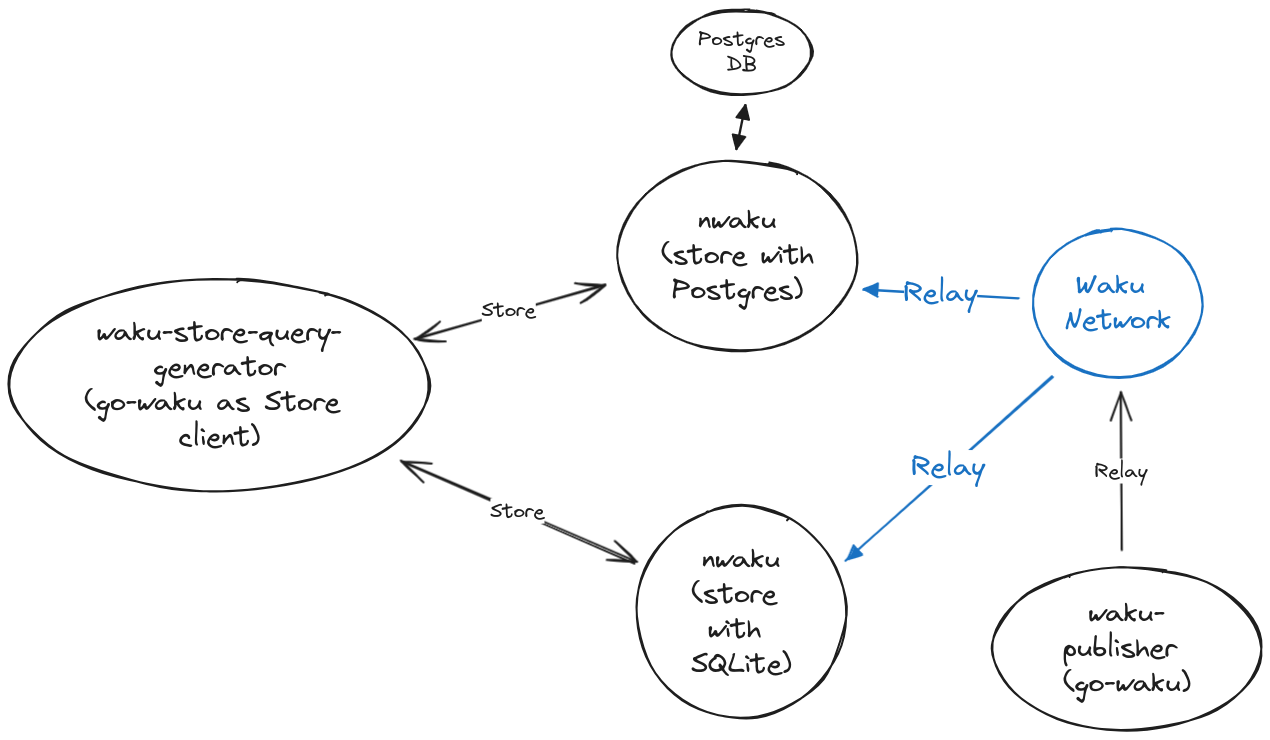
In this test suite, only the Store protocol is being analyzed, i.e. without REST. For that, a go-waku node is used, which acts as Store client. On the other hand, we have another go-waku app that publishes random Relay messages periodically. Therefore, this can be considered a more realistic approach.
The following diagram shows the topology used:
For that, the next apps were used:
- Waku-publisher. This app can publish Relay messages with different numbers of clients
- Waku-store-query-generator. This app is based on the Waku-publisher but in this case, it can spawn concurrent go-waku Store clients.
That topology is defined in this docker-compose file.
Notice that the two nwaku nodes run the very same version, which is compiled locally.
Comparing archive SQLite & Postgres performance in nwaku-b6dd6899
The next results were obtained by running the docker-compose-manual-binaries.yml from test-waku-query-c078075 in the sandbox machine (metal-01.he-eu-hel1.wakudev.misc.status.im.)
Scenario 1
Store rate: 1 user generating 1 store-req/sec.
Relay rate: 1 user generating 10msg/sec, 10KB each.
In this case, we can see that the SQLite performance is better regarding the store requests.
The following graph shows how the SQLite node has blocking periods whereas the Postgres always gives a steady rate.
Scenario 2
Store rate: 10 users generating 1 store-req/sec.
Relay rate: 1 user generating 10msg/sec, 10KB each.
In this case, is more evident that the SQLite performs better.
Scenario 3
Store rate: 25 users generating 1 store-req/sec.
Relay rate: 1 user generating 10msg/sec, 10KB each.
In this case, the performance is similar regarding the timings. The store rate is bigger in SQLite and Postgres keeps the same level as in scenario 2.
Comparing archive SQLite & Postgres performance in nwaku-b452ed8
This nwaku commit is after a few Postgres optimizations were applied.
The next results were obtained by running the docker-compose-manual-binaries.yml from test-waku-query-c078075 in the sandbox machine (metal-01.he-eu-hel1.wakudev.misc.status.im.)
Scenario 1
Store rate 1 user generating 1 store-req/sec. Notice that the current Store query used generates pagination which provokes more subsequent queries than the 1 req/sec that would be expected without pagination.
Relay rate: 1 user generating 10msg/sec, 10KB each.
It cannot be appreciated but the average Store time was 11ms.
Scenario 2
Store rate: 10 users generating 1 store-req/sec. Notice that the current Store query used generates pagination which provokes more subsequent queries than the 10 req/sec that would be expected without pagination.
Relay rate: 1 user generating 10msg/sec, 10KB each.
Scenario 3
Store rate: 25 users generating 1 store-req/sec. Notice that the current Store query used generates pagination which provokes more subsequent queries than the 25 req/sec that would be expected without pagination.
Relay rate: 1 user generating 10msg/sec, 10KB each.
Conclusions
After comparing both systems, SQLite performs much better than Postgres However, a benefit of using Postgres is that it performs asynchronous operations, and therefore doesn’t consume CPU time that would be better invested in Relay for example.
Remember that nwaku is single-threaded and chronos performs orchestration among a bunch of async tasks, and therefore it is not a good practice to block the whole nwaku process in a query, as happens with SQLite
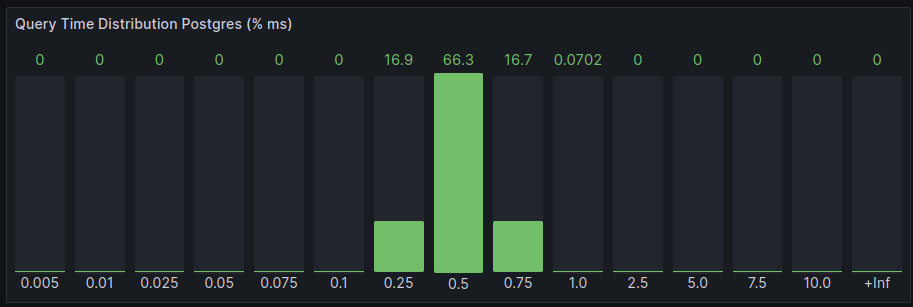
After applying a few Postgres enhancements, it can be noticed that the use of concurrent Store queries doesn’t go below the 250ms barrier. The reason for that is that most of the time is being consumed in this point. The libpqisBusy() function indicates that the connection is still busy even the queries finished.
Notice that we usually have a rate below 1100 req/minute in status.prod fleet (checked November 7, 2023.)
Multiple nodes & one single database
This study aims to look for possible issues when having only one single database while several Waku nodes insert or retrieve data from it. The following diagram shows the scenery used for such analysis.
There are three nim-waku nodes that are connected to the same database and all of them are trying to write messages to the same PostgreSQL instance. With that, it is very common to see errors like:
ERR 2023-11-27 13:18:07.575+00:00 failed to insert message topics="waku archive" tid=2921 file=archive.nim:111 err="error in runStmt: error in dbConnQueryPrepared calling waitQueryToFinish: error in query: ERROR: duplicate key value violates unique constraint \"messageindex\"\nDETAIL: Key (storedat, id, pubsubtopic)=(1701091087417938405, 479c95bbf74222417abf76c7f9c480a6790e454374dc4f59bbb15ca183ce1abd, /waku/2/default-waku/proto) already exists.\n
The db-postgres-hammer is aimed to stress the database from the select point of view. It performs N concurrent select queries with a certain rate.
Results
The following results were obtained by using the sandbox machine (metal-01.he-eu-hel1.wakudev.misc) and running nim-waku nodes from b452ed8654 and using the test-waku-query project from fef29cea18
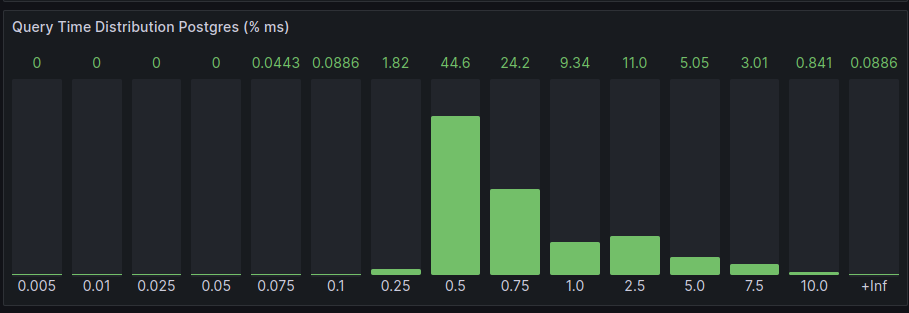
The following shows the results
- Two
nwaku-postgres-additionalinserting messages plus 50db-postgres-hammermaking 10selectsper second.
- Five
nwaku-postgres-additionalinserting messages plus 50db-postgres-hammermaking 10selectsper second.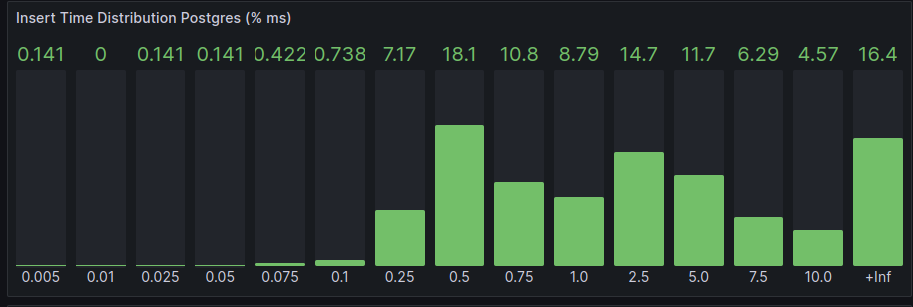
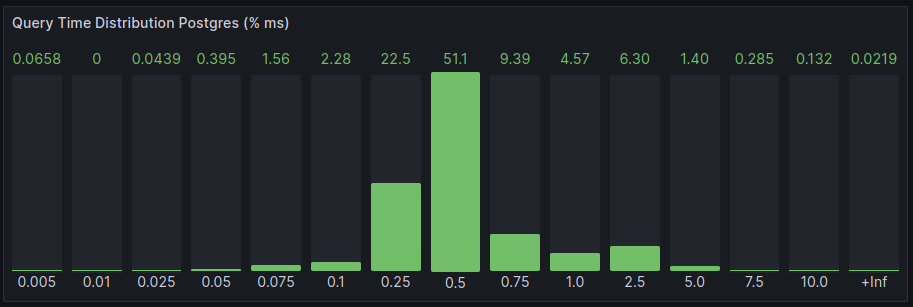
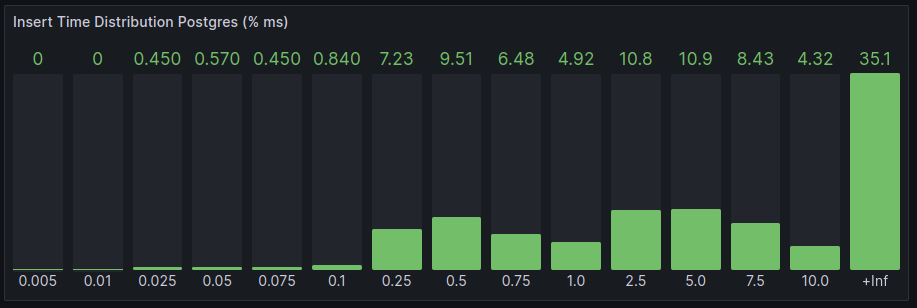
In this case, the insert time gets more spread because the insert operations are shared amongst five more nodes. The Store query time remains the same on average.
