5.8 KiB
Debugging
Inspecting re-frame with re-frisk
re-frisk is a state visualization tool written by our very own Andrey (@flexsurfer). With its help you can inspect the current state of app-db, watch event, etc.
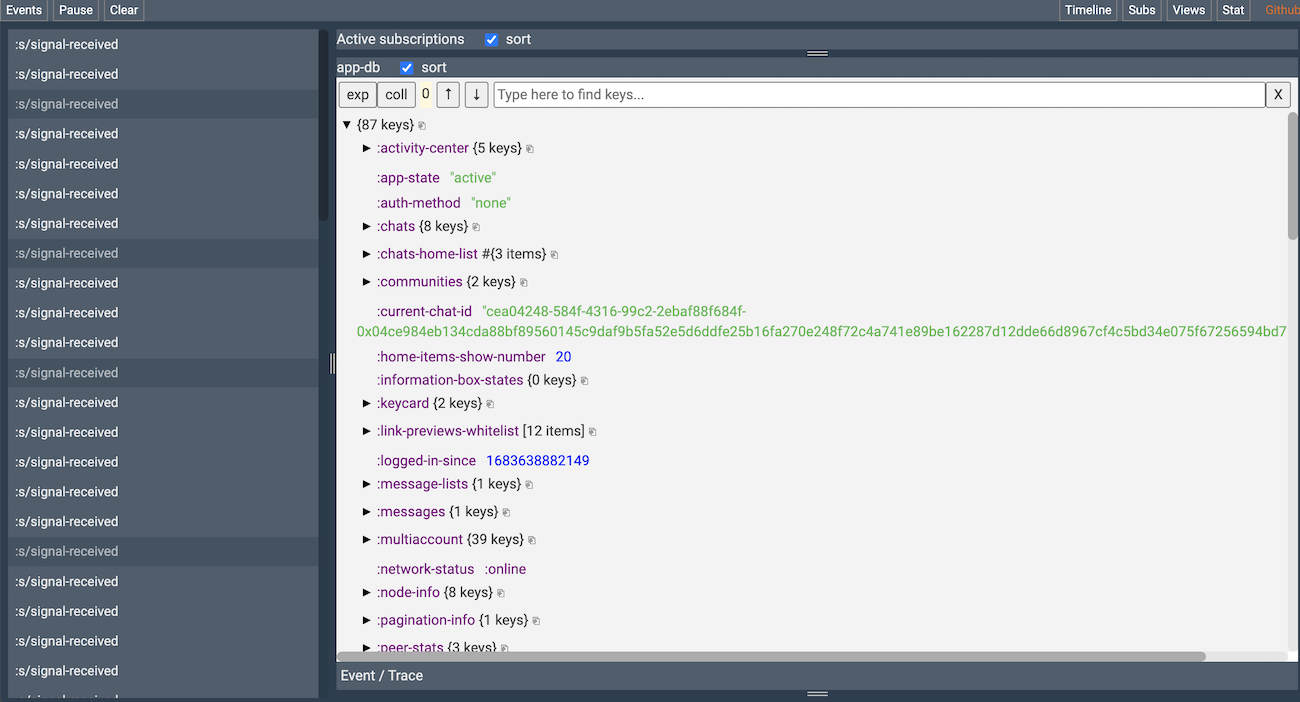
To start re-frisk, execute the following command:
$ yarn shadow-cljs run re-frisk-remote.core/start
or you can also use make:
$ make run-re-frisk
A server will be started at http://localhost:4567. It might show "not connected" at first. Don't worry and just start using the app. The events and state will populate.
More details about re-frisk are on the project page.
Enabling debug logs
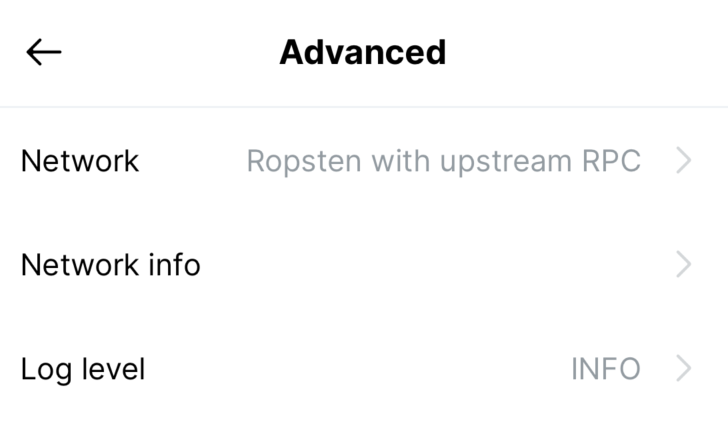
Calls to log/debug will not be printed to the console by default. It can be enabled under "Advanced settings" in the app:
Checking status-go logs
While status mobile works it saves logs from status-go to geth.log file.
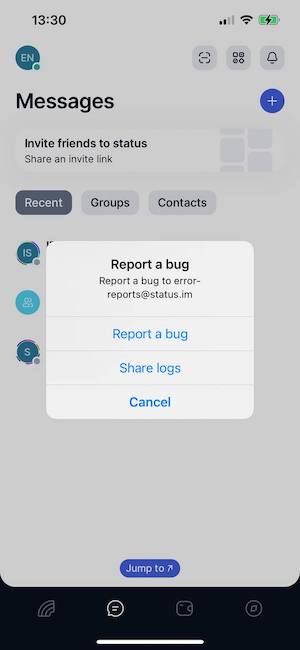
Checking logs from physical device
To obtain geth.log from physical device you need to shake it and in an opened menu select "Share logs".
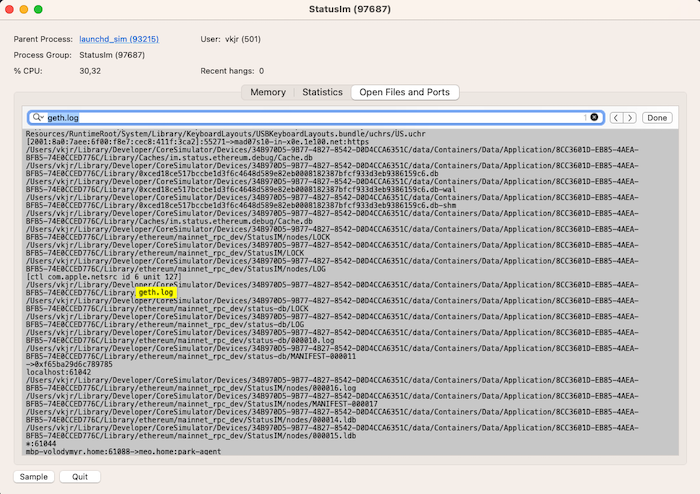
Checking logs from iOS Simulator
When developing with iOS simulator it is more convenient to see the geth.log updates in real-time.
To do this:
- open Activity Monitor
- find the "StatusIm" app and doubleclick it
- in the opened window select "Open files and ports" and find the full path to
geth.log(note that it won't appear until you login to Status app)
Inspecting database content
Encrypted database can be found using commands:
cd ~/Library/Developer/CoreSimulator/Devices
find ./ -name accounts.sql
To get unencrypted database you need to export it first:
- open the status app in simulator
- on login screen enter the correct password without logging in
- using repl execute statement to export db:
(re-frame.core/dispatch [:multiaccounts.login.ui/export-db-submitted]) - save generated
export.dbfile
Now you can locate the export.db and open it with preferred db viewer.
Android:
adb root
adb pull /storage/emulated/0/Android/data/im.status.ethereum.debug/files/Download/export.db /path/to/store/export.db
If you're using a release build, change the path to /storage/emulated/0/Android/data/im.status.ethereum/files/Download
iOS
cd ~/Library/Developer/CoreSimulator/Devices
find ./ -name export.db
Tips
From @ilmotta:
Something I find extremely convenient for Android is to use adb to tail logs. I don't use macOS so I don't know if the iOS simulator offers a CLI interface with the same capabilities.
But here's what I use for example:
adb shell tail -n 10 -f /storage/emulated/0/Android/data/im.status.ethereum.debug/files/Download/geth.log | grep 'waku.relay'
Also to inspect logs in a more flexible manner, instead of the strict output from make run-metro, I prefer adb logcat. Combined with enabling status-mobile logs in debug by default plus filtering the logs to only what I care during development, I find this helps me inspect the app without running re-frisk because with the debug log level I can already see which events are dispatched (one of the features I like the most from re-frisk).
adb logcat | grep 'ReactNativeJS\|StatusModule\|GoLog'
From @clauxx (visual debugging):
When building/fixing/refactoring components, it can be annoying to set-up the component for instant visual feedback (i.e. finding it in the UI when fixing/refactoring; finding a place for it when building from scratch). Very often if the location of the screen containing your component nested deeply in the app, you might have to do a lot of repeated navigation, nevermind logging in every time the app reloads (even with fast refresh disabled this happens quite often).
To alleviate this discomfort and make the development cycle more pleasant, you can use one of the following options (both of which involve the ... REPL ༼ つ ╹ ╹ ༽つ, so make sure you have that set-up with your IDE/editor)
REPL-ing to a screen
This one is straightforward, just evaluate a navigation dispatch form from anywhere:
(comment (rf/dispatch [:navigate-to :your-favorite-buggy-screen]))
TIP: you can run this from an untracked user namespace
(ns user), from which you can experiment or interact with the REPL. This is where I usually keep my development navigation forms.
REPL-ing a component
This is also straighforward, but there are some small differences. Just like above, we only have to evaluate a dispatch form, as follows:
;; example debugging a quo component, although it could be any other component e.g. from the `status-im2` ns.
(comment (re-frame/dispatch [:dev/preview-component
                      [quo/slide-button
                       {:track-icon          :face-id
                        :track-text          "preview component example"
                        :customization-color :blue
                        :on-complete         identity}]]))
When evaluated, a full-screen bottom sheet will appear with your component inside. You can make changes to the props or the component internals and re-evaluate the changed forms, after which the component will be re-mounted without running a reload (unless you save the file). Other times it's quicker to just hit save and the component will be reloaded as usual (except for the props you evaluated, which have to be re-evaluated when changed).
TIP: You can have multiple versions of the component as separate comments to check for the component variations
TIP: You can leave
commentblocks at the end of component files (other than quo, since can be previewed in other ways) with usages of components, which other developers can use for visualisation/testing.