13 KiB
re-frame-10x
re-frame-10x lets you instrument, and then inspect, the inner workings of a running re-frame application. It presents as a programmer's dashboard, delivering curated insight and illumination.
It helps you find false assumptions faster.
Show Me

Describe It To Me
It Is Epoch Oriented
re-frame applications are computationally regular. First an event happens,
and then boom, boom, boom go a series of known computational steps (aka dominoes),
in a known order. When this chain reaction completes,
a re-frame app enters a quiescent state waiting for another
event to kick off the next iteration of the same process.
Each re-frame event and its consequent computation forms a bounded "epoch"
which can be inspected, analysed and understood independently of other epochs. This
tool is epoch-oriented - it shows you one at a time.
And, yes, it has "time travel debugger" capabilities - you can go
backwards and forwards through epochs - but that's really not the most interesting or powerful aspect of what re-frame-10x delivers.
It Is About Trace Data
As it runs, re-frame logs "trace" as data, and this provides an x-ray (MRI?) of your app's inner
functioning. At its most basic level, re-frame-10x is a consumer, processor and presenter
of trace data.
It Is About The Data Flow
re-frame is a functional framework but it's design is "data oriented". It
"flows" data, in a loop, through the functions you provide.
To understand what is happening in your re-frame app, you must understand
what data is "happening".
It Is Always About The Data
So, that's two good re-frame-specific reasons why data is at the core of
re-frame-10x, but actually, the importance of data is even more fundamental
that that.
Each time you put a println into your program, you are printing out what?
And why? Invariably, it is data which fuels your debugging investigation,
confirming your current hypothesis, or not.
And when you write your unittests, you represent your expections as what? Code is proved correct by the data it produces.
So, for debugging and understanding activities, "more data, more easily" is winning. If
re-frame-10x does its job, it shouldn't be necessary for you to add printlns.
The data you need should be captured and presented, and, if further experimentation
is required, it should be available in your REPL too.
Data Brings Code To Life
Perhaps you have seen LightTable in action?
In the small, it is a delightfully productive debugging environment because it co-renders code with the data generated by running the code. The data provides a "paper trail" which brings the code to life, revealing its dynamics and enriching a programmer's understanding.
re-frame-10x has a similar goal, although the method is different.
It Is A Data Dashboard
Observing raw data trace is both interesting and valuable, but it isn't enough. First, we want to leverage this data for insights. And, second, there's often too much data - you can drown in the detail.
So, re-frame-10x tries to be a "dashboard" which curates this
"raw data" into "information" through various kinds of analysis
and "roll ups". It should deliver insight "at a glance", while still allowing
you to drill down into the detail.
Helps Me How?
Four ways:
-
It helps you to learn
re-frame. Simply looking at the "raw traces" provides insight into how it operates. Even experienced re-framians, er, like me, have learned a lot. -
It helps you to explore and learn an unfamiliar
re-framecodebase. When I click, over here, on this "X" button, it shows me what event isdispatch-ed and in which namespace the associated event handler is registered. And, "oh look, that's interesting - four subscriptions recalculated". Etc. -
It helps you with debugging. You see an x-ray of your app's functioning. In particular, it will assist you to write and debug event handlers, which is useful because they hold most of the logic in your
re-frameapps. -
It helps you to find performance problems and/or detect where there is unnecessary computation occurring.
Point 3, is primary, of course. But Point 2 is almost as important because we all spend a lot of our time groking unfamiliar codebases. Being able to observe the inner workings of a running app is a great way to bring code to life, reveal key features, and build a cognitive map of how the code is structured.
Temporary Warning
Some of the claims above are aspirational.
re-frame-10xremains a WIP.
Of Sausage And Sizzle
Internal discussion about a name meandered for a while. Initially, it was re-frame-trace, which is accurate, sure, but it is also 100% sausage because it talks about low level function, and not higher level benefit (sizzle, sizzle). Side stepping the issue, I wanted to call it vox-datum (voice of the data) but that was cruelly rejected, for reasons I don't care to remember. The pain. I mean, who the hell doesn't like a Latin name?? Philistines.
If benifit was a must, then there was -insight and -illumination, but adding either made the name waaaay too long. Naming things - it really is a nightmare!
Finally, -10x cheekily materialised, delivering 100 decibels of audacious sizzle, and consequently a challenge for us to live up to. A 10x programmer starts by having 10x more knowledge and insight - so go make that tool, smarty pants.
Installation
re-frame-10x configuration is per-project, only one person in your team needs to configure a project to use it, and then everyone else can benefit.
If you are using leiningen, modify project.clj in the following ways. When puzzling over the various possible leiningen configurations, it's often helpful to look at a sample project.clj.
IMPORTANT PREREQUISITES
- You must have a
:mainspecified in your:compilerconfig for the:preloadsand:closure-definesto take effect - You must be running with the Closure define
goog.DEBUGastrue. This is the default under:optimizations :none. - You must be using
:optimizations :none.
If you don't meet those pre-requisites, see the docs on advanced setups for other ways to install re-frame-10x.
Easy setup
-
Update your re-frame dependency to at least
0.10.5-[re-frame "0.10.5"]. -
Add re-frame-10x as a dev dependency by placing
[day8.re-frame/re-frame-10x "VERSION"]within:profiles :dev :dependencies, where"VERSION"is the version shown above. For example::profiles {:dev {:dependencies [[some-other-package "0.1.0"] [day8.re-frame/re-frame-10x "VERSION (see version above)"]] }}If your project uses React 16 and Reagent 0.8.0-alpha2 (or higher) then you will need to add the qualifier
-react16to the version, e.g.[day8.re-frame/re-frame-10x "VERSION-react16"]. -
Locate the
:compilermap under:devand add:closure-definesand:preloads.For example:
{:builds
   [{:id           "dev"
     :source-paths ["src" "dev"]
     :compiler     {...
                    :closure-defines      {"re_frame.trace.trace_enabled_QMARK_" true}
                    :preloads             [day8.re-frame-10x.preload]
                    :main                 "myapp.core" ;; You must specify a :main or follow the advanced setup ^^^
                    }}]}
:closure-defines {"re_frame.trace.trace_enabled_QMARK_" true}:preloads [day8.re-frame-10x.preload]
cljs-devtools is not required to use re-frame-10x, but it is highly recommended.
React Native Setup
To use re-frame-10x with React Native do the following:
- Add
goog.global.CLOSURE_UNCOMPILED_DEFINES = {"re_frame.trace.trace_enabled_QMARK_":true};tofigwheel-bridge.jsWe need to do this because:closure-definesdoesn't work in RN. More info here: https://github.com/drapanjanas/re-natal/issues/46 - Have
lein-re-frisk>0.5.5re-frisk-remote>0.5.4 andre-frisk-sidecar>0.5.5 added to yourproject.cljSetup instructions here: https://github.com/flexsurfer/re-frisk
You could use this PR https://github.com/status-im/status-react/pull/3521 as an example of what needs to be done to make it work with RN
Usage
-
Make sure you have followed all of the installation instructions above.
-
Start up your application.
-
Once it is loaded, focus the document window and press
ctrl-hto slide open the trace panel and enable tracing. -
When the panel is closed, tracing is disabled.
Use Cases
app-db

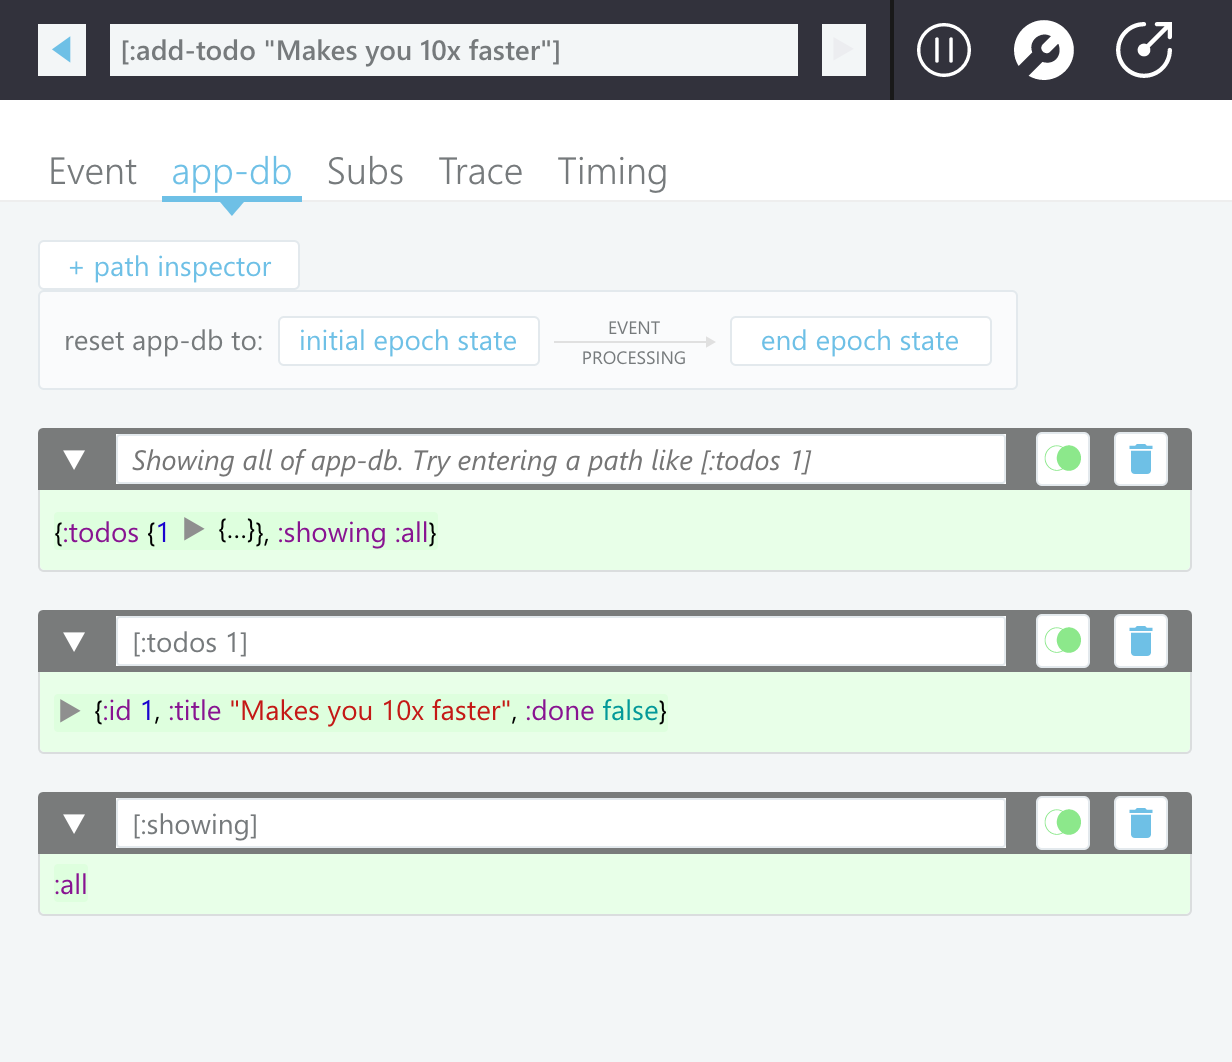
- Inspect a portion of app-db's state with the path inspector, allowing you to focus on just the parts you care about.
- Reset app-db to before an event was run to run it again, instead of resetting the whole application
- Toggle app-db before and after states for running an event, to inspect UI changes.
Subs

- See the output and diff of a subscription running
- Spot layer 2 subscriptions that should really be layer 3's.
- Spot subscriptions that are running when they shouldn't
- Spot subscriptions that are being destroyed and recreated unnecessarily
Timing

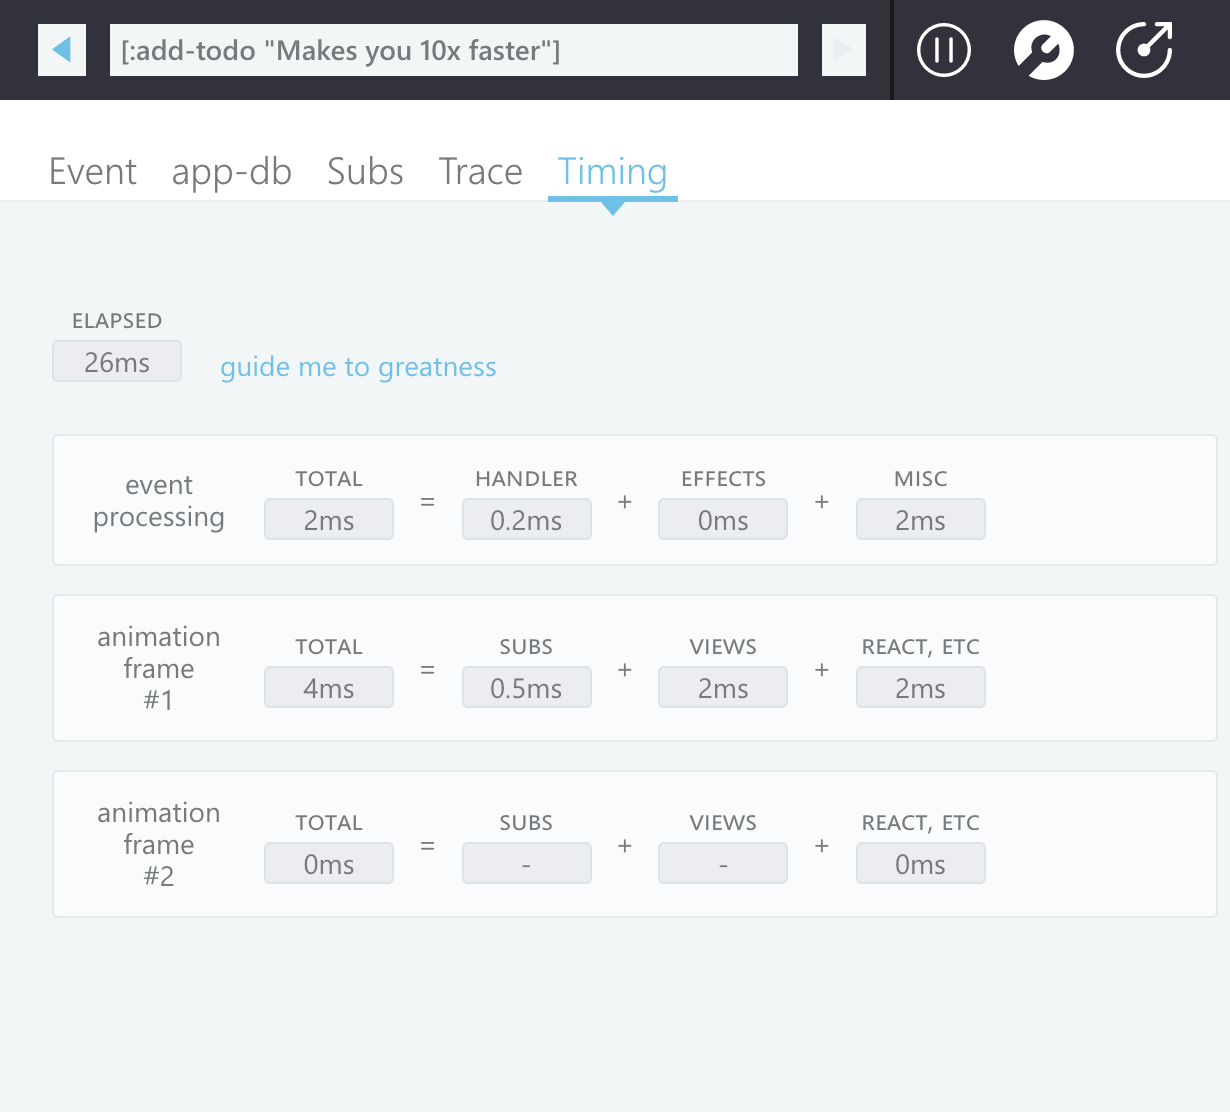
- Answer the question "Why is my app slow when it runs this event?"
- See whether time is spent in processing an event, running the subscriptions, or rendering the changes
Event

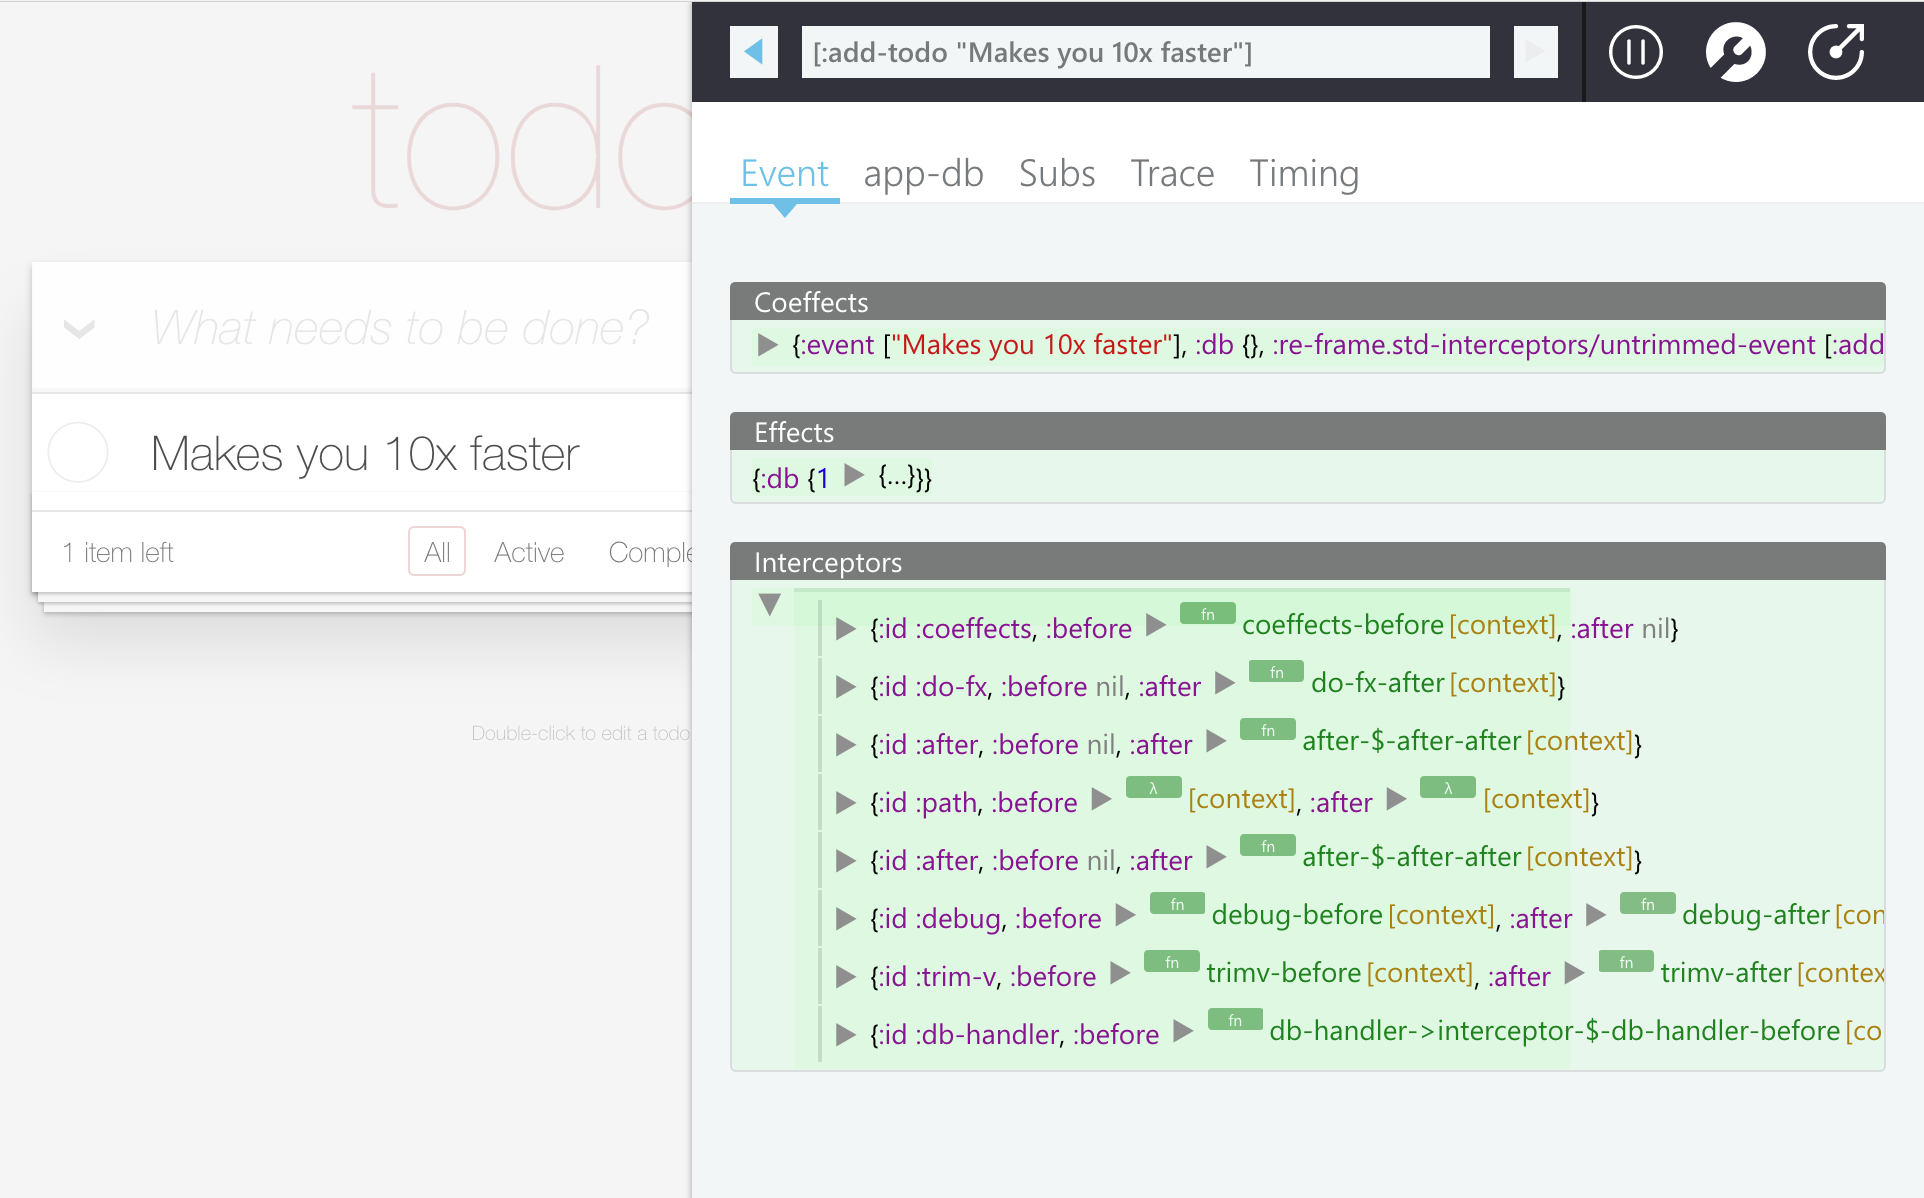
- See the coeffects given to an event handler
- See the effects produced by an event handler
- See the interceptors involved in handling an event.
Trace

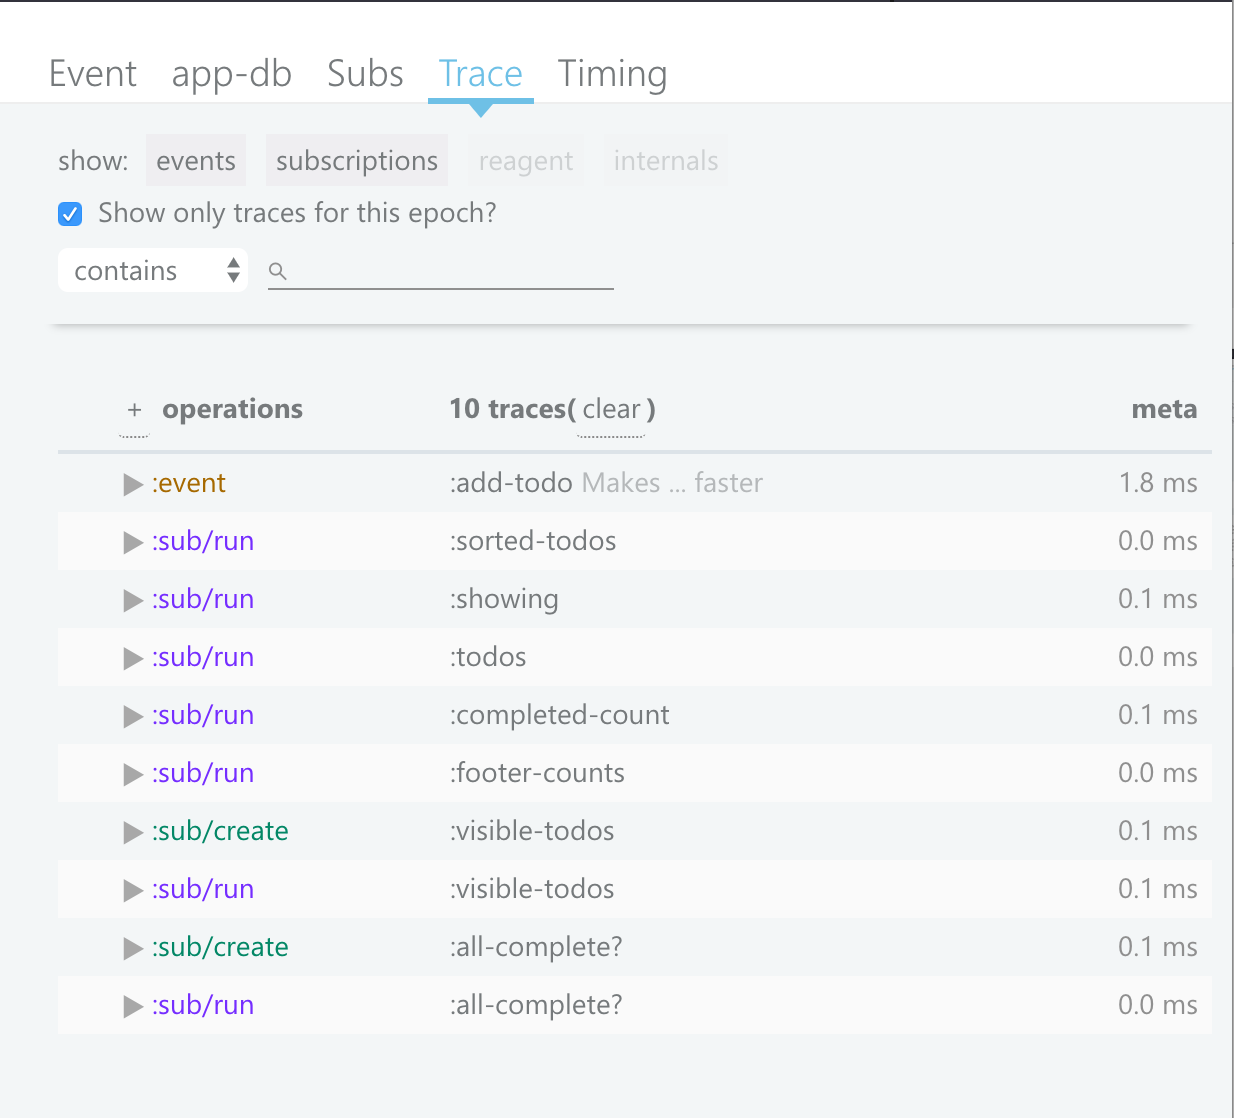
- Dig into the low level execution details of an epoch. We've tried to surface the useful information in the other panels, so if you're constantly referring to this panel, open an issue with your use case.
Troubleshooting
- Try a
lein clean - Make sure you have followed all the installation steps.
- Make sure you have checked the prerequisites
If the re-frame-10x window won't show up when pressing Ctrl-H
- Make sure that your browser window doesn't have focus in a text-box or something else that is intercepting keyboard events.
If re-frame-10x throws an exception on startup
- Reset the settings to factory defaults in the settings panel
- If you can't load the settings panel, run
day8.re_frame_10x.trace.factory_reset_BANG_()in the JavaScript console. - If neither of those work, remove all of the keys with the prefix
day8.re-frame.tracefrom your browser's Local Storage.
How does it work?
re-frame is instrumented - all important activity generates trace data.
re-frame-10x consumes this trace data and renders useful visualisations of the re-frame process. Currently, re-frame's tracing capabilities are in alpha and are subject to change at any time. We're testing the utility of the the trace by building an app on top.
By default, re-frame tracing is "compiled out", so it won't impose a performance cost in production. The trade-off here is that you need to explicitly enable it in development.
The preloads option (:preloads [day8.re-frame-10x.preload]) has to be set in order to automatically monkeypatch Reagent to add appropriate lifecycle hooks. Yes this is gross, and yes we will make a PR to reagent to add proper hooks, once we know exactly what we need. The preload namespace also injects a div containing the devtools panel into the DOM.
Developing/Contributing
If you want to work on re-frame-10x, see DEVELOPERS.md.
Citations
- open by Bluetip Design from the Noun Project
- reload by Adnen Kadri from the Noun Project
- Camera by Christian Shannon from the Noun Project
- Delete by logan from the Noun Project
- Settings by arjuazka from the Noun Project
- Wrench by Aleksandr Vector from the Noun Project
- pause by Bhuvan from the Noun Project
- play by Bhuvan from the Noun Project
- Log Out by Arthur Shlain from the Noun Project
