re-frame-trace
re-frame-trace let's you look at the inner workings of a running re-frame application. It presents as a programmer's dashboard, delivering curated insight and illumination. So, you'll use it to better understand your application and to debug it.
Status: Beta. 
Note also use the latest version of re-frame itself - currently v0.10.4 (but please check yourself - out of date docs and all that)
It Is Epoch Oriented
re-frame applications are computationally regular. First an event happens,
and then boom, boom, boom go a series of known computational steps (dominoes),
in a known order. When this chain reaction completes,
a re-frame app lapses into a quiescent state waiting for another
event to kick off the next iteration of the same process.
Each re-frame event and its consequent computation forms a bounded "epoch"
which can be inspected, analysed and understood independently of other epochs. This
tool is epoch-oriented - it shows you one at a time.
And, yes, it has "time travel debugger" capabilities - you can go backwards
and forwards through epochs - but that's really not the most interesting or powerful
aspect of what re-frame-trace delivers.
It Is All About Trace Data
As it runs, re-frame logs "trace" as data (not strings).
This data trace provides an x-ray of your app's functioning.
re-frame-trace is essentially a consumer, processor and displayer of this xray trace data.
More Data
While re-frame is a functional framework, it is
strongly defined by its "data oriented" design. re-frame
"flows" data, in a loop, through the functions you provide.
To understand what is happening in a re-frame app, you must understand
what data is happening.
So, data is at the core of re-frame-trace in both of the ways just described,
and data is a powerful and leverageable substrate.
It Is A Data Dashboard
Except, there's often too much data - you can drown in the detail.
So, re-frame-trace tries to be a "dashboard" which curates the
"raw data" into "information" through various kinds of analysis
and "roll ups". It should deliver insight "at a glance", while still allowing
you to drill down into the detail.
Okay. So, we now know enough to do a summary: this tool is an epoch-oriented, interactive data dashboard which delivers insights and assists debugging.
Which Is Helpful How?
Four ways:
- It helps you to learn
re-frame. Simply looking at the "raw traces" provides insight into how it operates. Even experienced re-framians, er, like me, have learned a lot. - It helps you to explore and learn an unfamiliar
re-framecodebase. When I click, over here, on this "X" button, it shows me what event isdispatch-ed and in what namespace the associated event handler is registered. And, "oh look, that's interesting - four subscriptions recalculated". Etc. - It helps you with debugging. You see an x-ray of your app's functioning.
In particular, it will assist you to write and debug
event handlers, which is useful because they hold most of the logic
in your
re-frameapps. - It helps you to find performance problems and/or detect where there is unnecessary computation occurring.
Temporary Warning
Some of the descriptions above are aspirational.
re-frame-traceremains a WIP experiment. But we're getting there.
A Visual Sampler
Installation
If you are using leiningen, modify project.clj in the following ways. When puzzling over the various possible leiningen configurations, it's often helpful to look at a sample project.clj.
-
Update your re-frame dependency to at least
0.10.4-[re-frame "0.10.4"]. -
Add re-frame-trace as a dev dependency by placing
[day8.re-frame/trace "VERSION"]within:profiles :dev :dependencies. For example::profiles {:dev {:dependencies [[some-other-package "0.0.0"] [day8.re-frame/trace "0.0.0 (see version above)"]] }}If your project uses React 16 and Reagent 0.8.0-alpha2 (or higher) then you will need to add the qualifier
-react16to the version, e.g.[day8.re-frame/trace "0.0.0-react16"]. -
Locate the
:compilermap under:devand add::closure-defines {"re_frame.trace.trace_enabled_QMARK_" true}:preloads [day8.re-frame.trace.preload]
For example:
{:builds
   [{:id           "dev"
     :source-paths ["src" "dev"]
     :compiler     {...
                    :closure-defines      {"re_frame.trace.trace_enabled_QMARK_" true}
                    :preloads             [day8.re-frame.trace.preload]
                    }}]}
cljs-devtools is not required to use re-frame-trace, but it is highly recommended.
Usage
-
Make sure you have followed all of the installation instructions above.
-
Start up your application.
-
Once it is loaded, focus the document window and press
ctrl-hto slide open the trace panel and enable tracing. -
When the panel is closed, tracing is disabled.
Use Cases
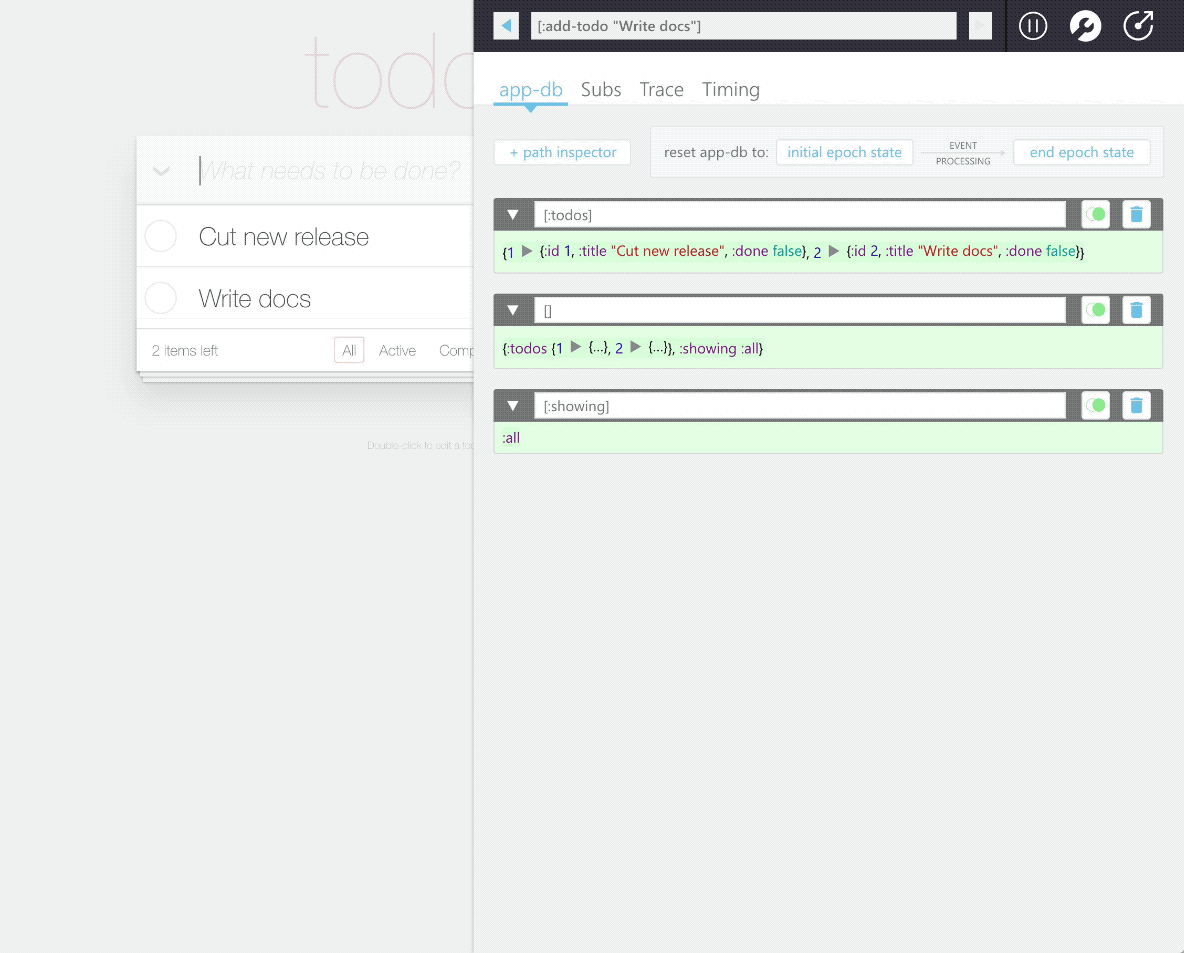
app-db
- Inspect a portion of app-db's state with the path inspector, allowing you to focus on just the parts you care about.
- Reset app-db to before an event was run to run it again, instead of resetting the whole application
- Toggle app-db before and after states for running an event, to inspect UI changes.
Timing
- Answer the question "Why is my app slow when it runs this event?"
- See whether time is spent in processing an event, or rendering the changes
Troubleshooting
- Try a
lein clean - Make sure you have followed all the installation steps.
If re-frame-trace throws an exception on startup
- Reset the settings to factory defaults in the settings panel
- If you can't load the settings panel, run
day8.re_frame.trace.factory_reset_BANG_()in the JavaScript console. - If neither of those work, remove all of the keys with the prefix
day8.re-frame.tracefrom your browser's Local Storage.
How does it work?
re-frame is instrumented - all important activity generates trace data. re-frame-trace consumes this trace data and renders useful visualisations of the re-frame process. Currently, re-frame's tracing capabilities are in alpha and are subject to change at any time. We're testing the utility of the the trace by building an app on top.
By default, re-frame tracing is "compiled out", so it won't impose a performance cost in production. The trade-off here is that you need to explicitly enable it in development.
The preloads option (:preloads [day8.re-frame.trace.preload]) has to be set in order to automatically monkeypatch Reagent to add appropriate lifecycle hooks. Yes this is gross, and yes we will try and make a PR to reagent to add proper hooks, once we know exactly what we need. The preload namespace also injects a div containing the devtools panel into the DOM.
Developing/Contributing
If you want to work on re-frame-trace, see DEVELOPERS.md.
Citations
- open by Bluetip Design from the Noun Project
- reload by Adnen Kadri from the Noun Project
- Camera by Christian Shannon from the Noun Project
- Delete by logan from the Noun Project
- Settings by arjuazka from the Noun Project
- Wrench by Aleksandr Vector from the Noun Project
- pause by Bhuvan from the Noun Project
- play by Bhuvan from the Noun Project
- Log Out by Arthur Shlain from the Noun Project