|
|
||
|---|---|---|
| .idea | ||
| docs/images | ||
| src/day8/re_frame | ||
| test/day8/re_frame/trace | ||
| .gitignore | ||
| LICENSE | ||
| README.md | ||
| project.clj | ||
README.md
re-frame-trace
A trace window for re-frame
Motivation
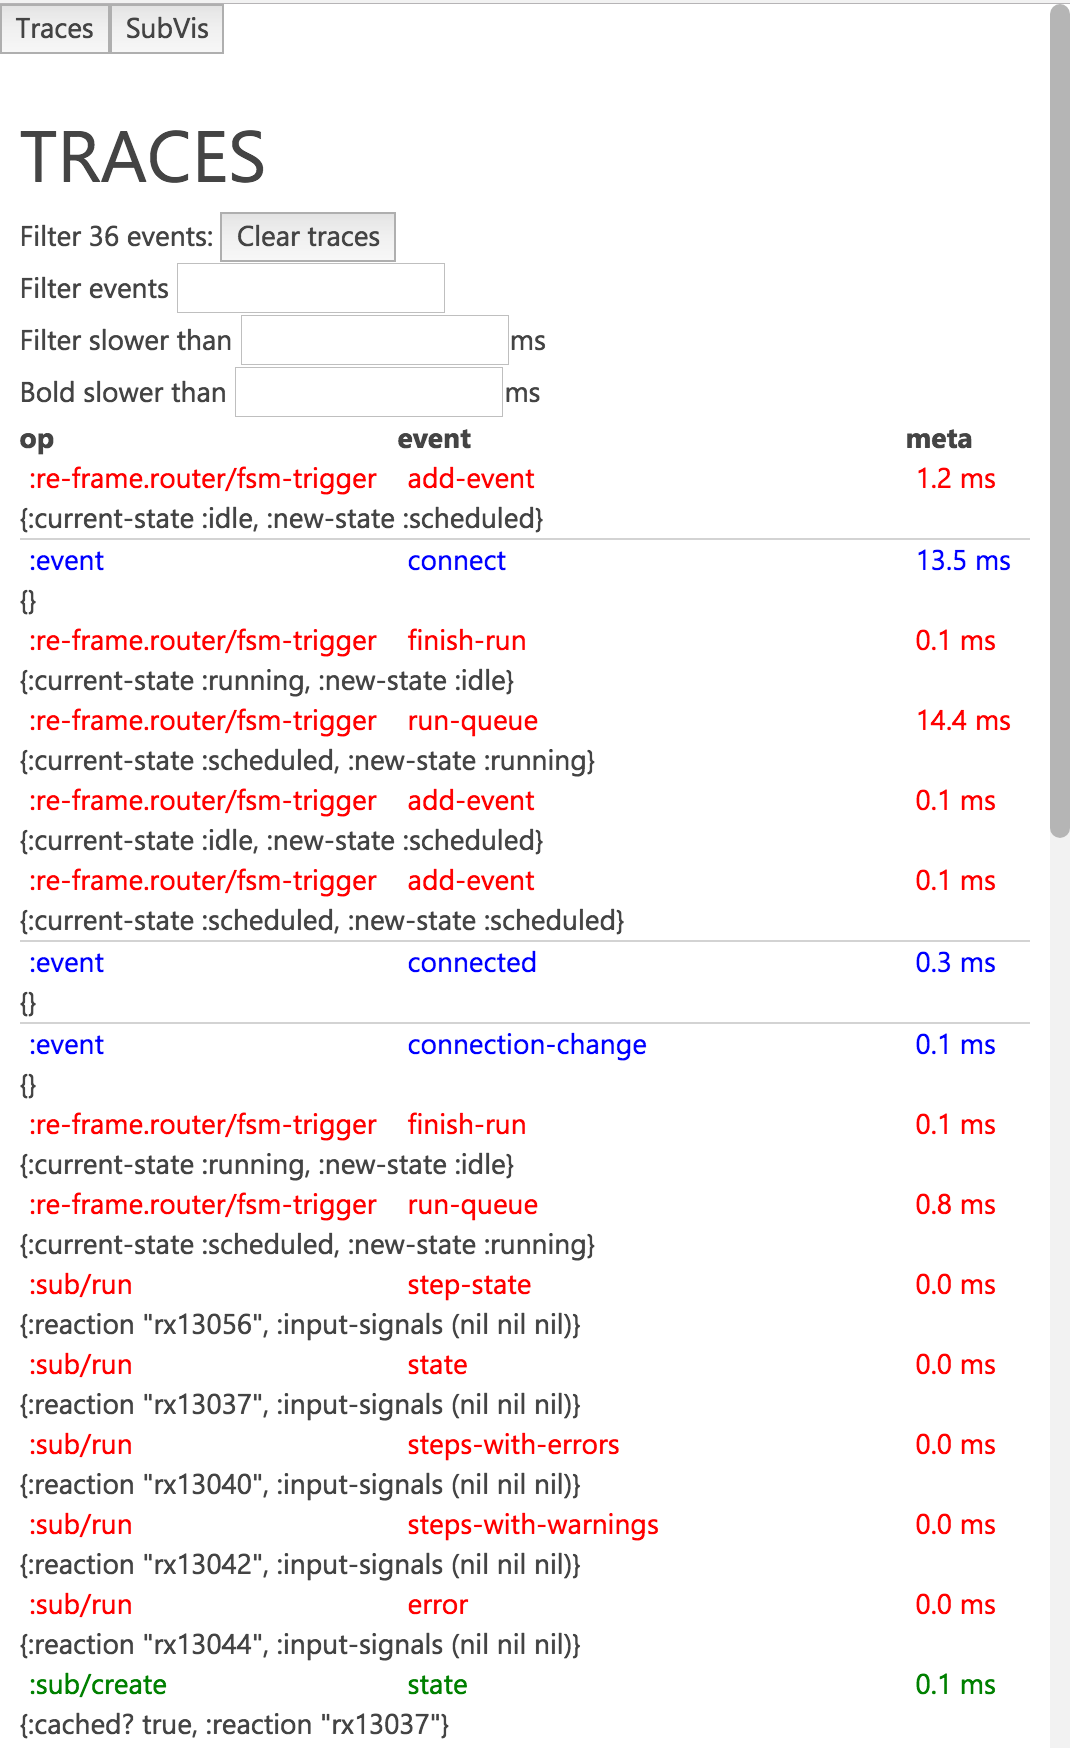
re-frame provides a data driven architecture, but we need to be able to inspect it. re-frame-trace takes inspiration from redux-devtools, and provides several ways to visualise the structure and state of your re-frame application.
How does it work?
re-frame has instrumentation to collect traces throughout various important points in the lifecycle of a re-frame app. re-frame-trace is a consumer of these traces, and provides visualisations of the traces. These traces have a well-defined structure, and will eventually be standardised, allowing other developers to create their own tooling to work against the traces. Currently, re-frame's tracing and re-frame-trace are in alpha and are subject to change at any time. Caveat usor [sic].
Getting started
There are three requirements to use re-frame-trace:
-
Compile your app with
:closure-defines: "re_frame.trace.trace_enabled_QMARK_" true, e.g.{:builds [{:id "dev" :source-paths ["src" "dev"] :compiler {... :closure-defines {"re_frame.trace.trace_enabled_QMARK_" true}}}]}By default, re-frame tracing is compiled out, so it won't impose a performance cost in production. The trade-off here is that you need to explicitly enable it in development.
-
In your app's startup method, call
day8.re-frame.trace/init-tracing!to monkeypatch Reagent to add appropriate lifecycle hooks. Yes this is gross, and yes we will try and make a PR to reagent to add proper hooks, once we know exactly what we need. N.B.: because re-frame-trace is a development time only dependency, you may need to create two separate source folders,devandprodto get isolation. Thedevfolder would contain aninit!function in themyapp.bootnamespace which callsinit-tracing!, while the prod version ofinit!would be a no-op. It may be possible to use preloads in the future to remove this step entirely. -
In your app's view code, add in
day8.re-frame.trace/devtoolsas a sibling to the root application view. For example, if your app looks like this:(defn main [] [re-com/v-box ;; your app here ]) (defn ^:export start-app [] (myapp.boot/init!) (reagent/render (fn [] [main]) (.getElementById js/document "app")))then you need to modify
mainto look something like:(defn main [] [:div [re-com/v-box ;; your app here ] [trace/devtools]) ;; day8.re-frame.trace is aliased is trace
Now you can start up your application. Once it is loaded, press Ctrl+H to slide open the trace panel and enable tracing. When the panel is closed, tracing is disabled.