This is more reliable than looking for the namespace, as reagent does not attempt to keep namespace information when compiled with Closure, whereas "devtools outer" is hard-coded as the :display-name for the panel's container and survives compilation/optimization.
re-frame-trace
A trace panel for re-frame.
Status: Alpha.
Motivation
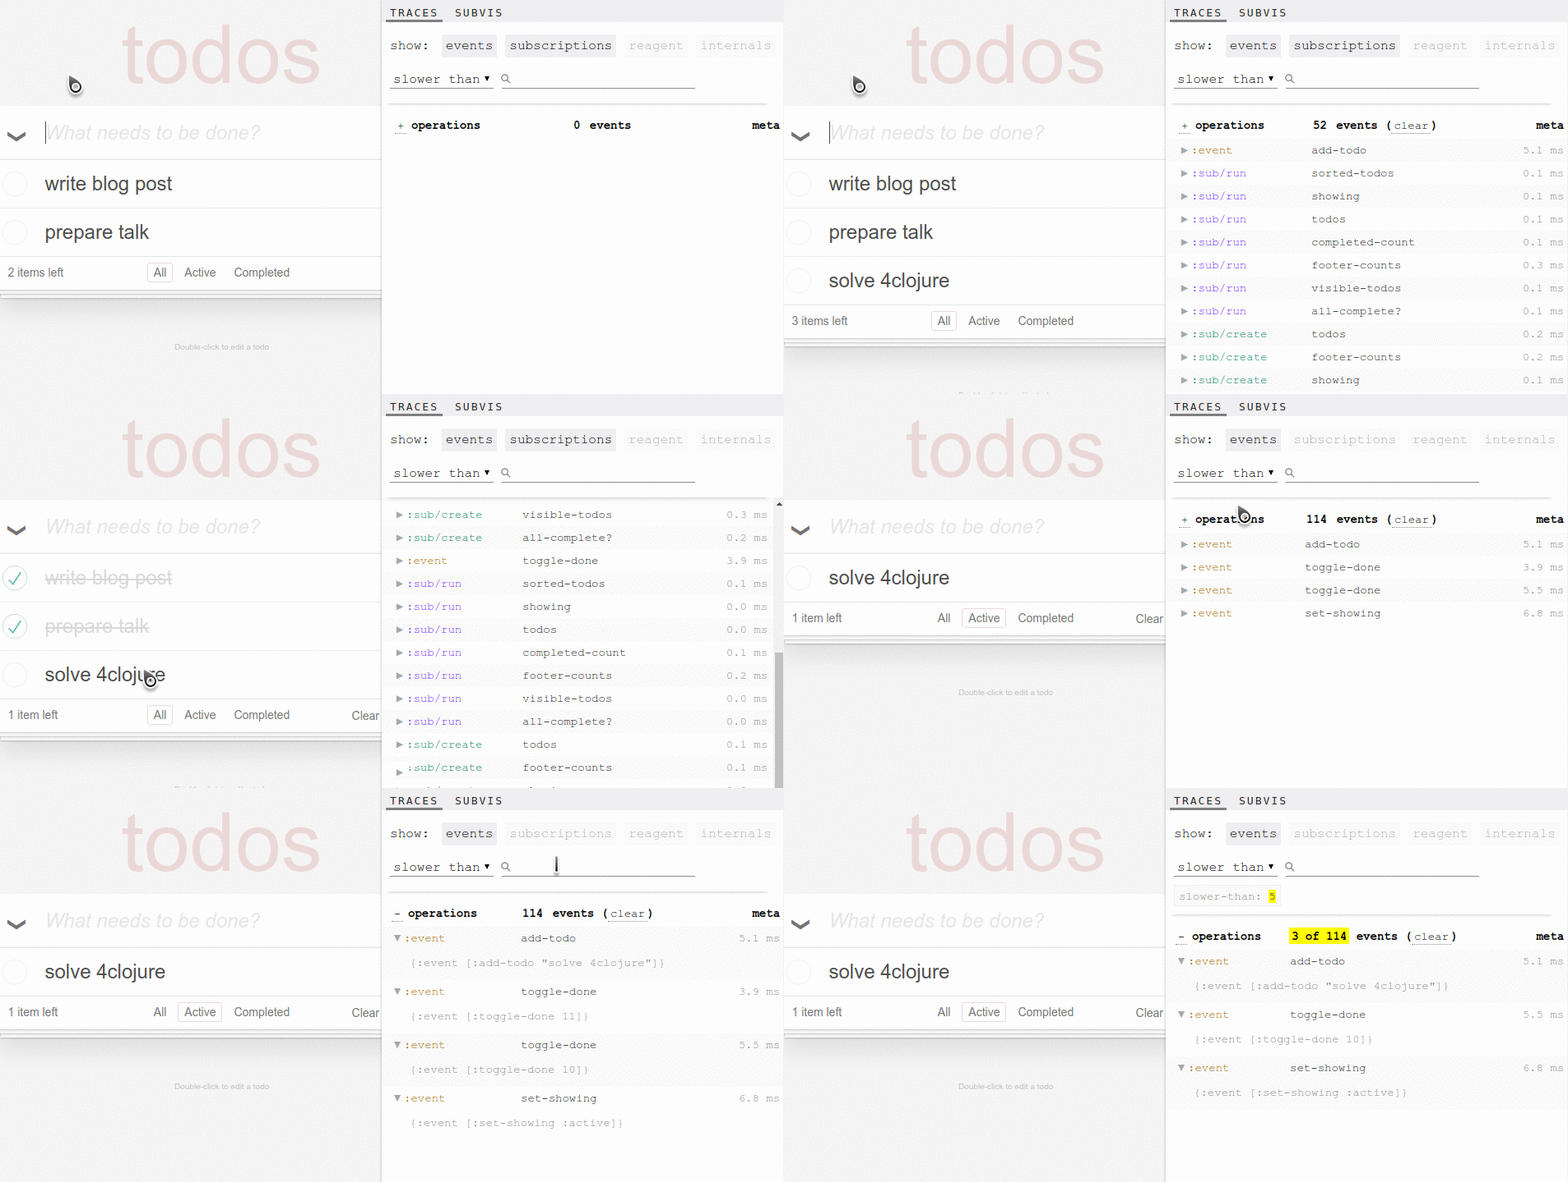
re-frame provides a data driven architecture, but we need to be able to inspect it. re-frame-trace takes inspiration from redux-devtools, and provides several ways to visualise the structure and state of your re-frame application.

Installation
If you are using leiningen, modify project.clj in the following ways. When puzzling over the various possible leiningen configurations, it's often helpful to look at a sample project.clj.
-
Add re-frame-trace as a dev dependency by placing
[day8.re-frame/trace "VERSION"]within:profiles :dev :dependencies. For example::profiles {:dev {:dependencies [[some-other-package "0.0.0"] [day8.re-frame/trace "0.0.0 (see version above)"]] }} -
Locate the
:compilermap under:devand add::closure-defines {"re_frame.trace.trace_enabled_QMARK_" true}:preloads [day8.re-frame.trace.preload]
For example:
{:builds
   [{:id           "dev"
     :source-paths ["src" "dev"]
     :compiler     {...
                    :closure-defines      {"re_frame.trace.trace_enabled_QMARK_" true}
                    :preloads             [day8.re-frame.trace.preload]}}]}
cljs-devtools is not required to use re-frame-trace, but it is highly recommended.
Usage
-
Make sure you have followed all of the installation instructions above.
-
Start up your application.
-
Once it is loaded, focus the document window and press
ctrl-hto slide open the trace panel and enable tracing. -
When the panel is closed, tracing is disabled.
Troubleshooting
- Try a
lein clean - Make sure you have followed all the installation steps.
How does it work?
re-frame has instrumentation to collect traces throughout various important points in the lifecycle of a re-frame app. re-frame-trace is a consumer of these traces, and provides visualisations of the traces. These traces have a well-defined structure, and will eventually be standardised, allowing other developers to create their own tooling to work against the traces. Currently, re-frame's tracing and re-frame-trace are in alpha and are subject to change at any time.
By default, re-frame tracing is compiled out, so it won't impose a performance cost in production. The trade-off here is that you need to explicitly enable it in development.
The preloads option (:preloads [day8.re-frame.trace.preload]) has to be set in order to automatically monkeypatch Reagent to add appropriate lifecycle hooks. Yes this is gross, and yes we will try and make a PR to reagent to add proper hooks, once we know exactly what we need. The preload namespace also injects a div containing the devtools panel into the DOM.
Developing/Contributing
If you want to work on re-frame-trace, see DEVELOPERS.md.
