Validator monitoring gained 2 new metrics for tracking when blocks are
included or not on the head chain.

Similar to attestations, if the block is produced in epoch N, reporting
will use the state when switching to epoch N+2 to do the reporting (so
as to reasonably stabilise the block inclusion in the face of reorgs).
These are Grafana dashboards exported to JSON and a sample Prometheus configuration, to get you started.
beacon_nodes_Grafana_dashboard.json
Can be loaded in a local Grafana instance directly.
metrics.status.im.json
Exported from https://metrics.status.im/d/pgeNfj2Wz23/nimbus-fleet-testnets?orgId=1. It diverged a little from "beacon_nodes_Grafana_dashboard.json" by adding Netdata metrics and a few extra panels.
In order to use it locally, you would have to make some changes:
-
remove
beacon_current_epoch{job=\"beacon-node-metrics\"},from the "instance" variable query -
disable the "container" variable by removing
,container=\"${container}\"from all panel queries
exporting instructions (for developers)
Click the small "share" icon on the top-left of the Grafana dashboard:
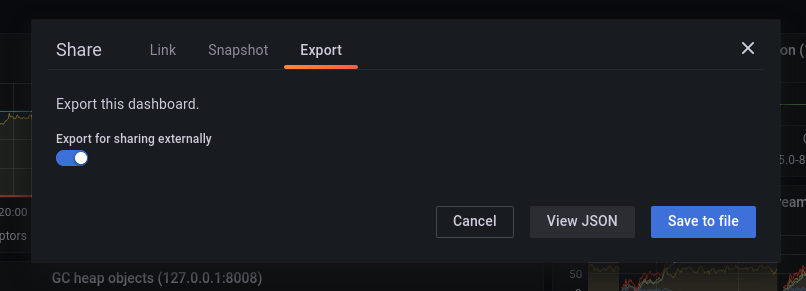
Go to the "Export" tab and enable "Export for sharing externally":
Now you can either "Save to file" or "View JSON" and copy/paste into the destination file, whichever is faster for you.

