* add img for health.md * add imgs for metrics.md * add imgs for email.md * add img for developers.md * add imgs for grafana/readme.md --------- Co-authored-by: Etan Kissling <etan@status.im> |
||
|---|---|---|
| .. | ||
| img | ||
| README.md | ||
| beacon_nodes_Grafana_dashboard.json | ||
| metrics.status.im.json | ||
| prometheus.yml.example | ||
README.md
These are Grafana dashboards exported to JSON and a sample Prometheus configuration, to get you started.
beacon_nodes_Grafana_dashboard.json
Can be loaded in a local Grafana instance directly.
metrics.status.im.json
Exported from https://metrics.status.im/d/pgeNfj2Wz23/nimbus-fleet-testnets?orgId=1. It diverged a little from "beacon_nodes_Grafana_dashboard.json" by adding Netdata metrics and a few extra panels.
In order to use it locally, you would have to make some changes:
-
remove
beacon_current_epoch{job=\"beacon-node-metrics\"},from the "instance" variable query -
disable the "container" variable by removing
,container=\"${container}\"from all panel queries
exporting instructions (for developers)
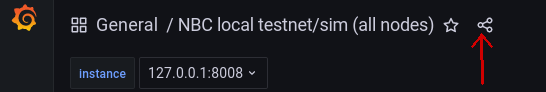
Click the small "share" icon on the top-left of the Grafana dashboard:
Go to the "Export" tab and enable "Export for sharing externally":
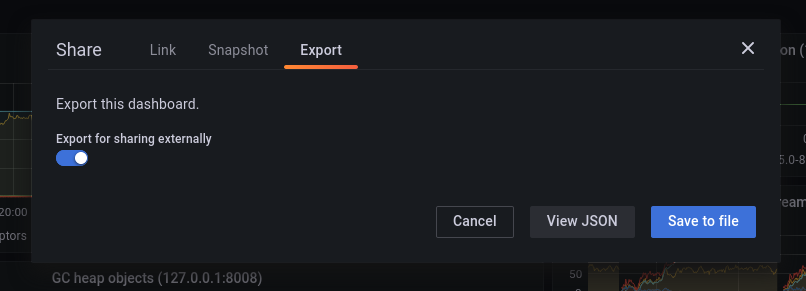
Now you can either "Save to file" or "View JSON" and copy/paste into the destination file, whichever is faster for you.