It is common for many accounts to share the same code - at the database
level, code is stored by hash meaning only one copy exists per unique
program but when loaded in memory, a copy is made for each account.

Further, every time we execute the code, it must be scanned for invalid
jump destinations which slows down EVM exeuction.

Finally, the extcodesize call causes code to be loaded even if only the
size is needed.

This PR improves on all these points by introducing a shared
CodeBytesRef type whose code section is immutable and that can be shared
between accounts. Further, a dedicated `len` API call is added so that
the EXTCODESIZE opcode can operate without polluting the GC and code
cache, for cases where only the size is requested - rocksdb will in this
case cache the code itself in the row cache meaning that lookup of the
code itself remains fast when length is asked for first.

With 16k code entries, there's a 90% hit rate which goes up to 99%
during the 2.3M attack - the cache significantly lowers memory
consumption and execution time not only during this event but across the
board.
Premix
Premix is premium gasoline mixed with lubricant oil and it is used in two-stroke internal combustion engines. It tends to produce a lot of smoke.
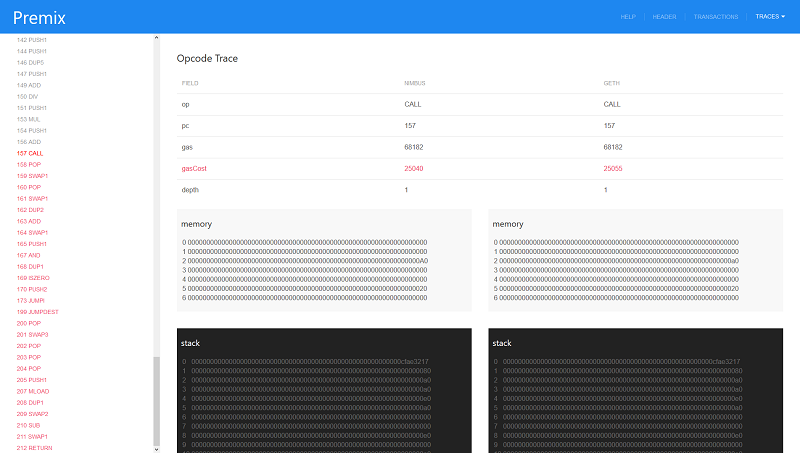
This Premix is a block validation debugging tool for the Nimbus Ethereum client. Premix will query transaction execution steps from other Ethereum clients and compare them with those generated by Nimbus. It will then produce a web page to present comparison results that can be inspected by the developer to pinpoint the faulty instruction.
Premix will also produce a test case for the specific problematic transaction, complete with a database snapshot to execute transaction validation in isolation. This test case can then be integrated with the Nimbus project's test suite.
Requirements
Before you can use the Premix debugging tool there are several things you need
to prepare. The first requirement is a recent version of geth installed from
source or
binary. The minimum
required version is 1.8.18. Beware that version 1.8.x contains bugs in
transaction tracer, upgrade it to 1.9.x soon after it has been released.
Afterwards, you can run it with this command:
geth --rpc --rpcapi eth,debug --syncmode full --gcmode=archive
You need to run it until it fully syncs past the problematic block you want to
debug (you might need to do it on an empty db, because some geth versions will
keep on doing a fast sync if that's what was done before). After that, you can
stop it by pressing CTRL-C and rerun it with the additional flag --maxpeers 0 if you want it to stop syncing
- or just let it run as is if you want to keep syncing.
The next requirement is building Nimbus and Premix:
# in the top-level directory:
make
After that, you can run Nimbus with this command:
./build/nimbus --prune:archive --port:30304
Nimbus will try to sync up to the problematic block, then stop and execute
Premix which will then load a report page in your default browser. If it fails
to do that, you can see the report page by manually opening
premix/index.html.
In your browser, you can explore the tracing result and find where the problem is.
Tools
Premix
Premix is the main debugging tool. It produces reports that can be viewed in
a browser and serialised debug data that can be consumed by the debug tool.
Premix consumes data produced by either nimbus, persist, or dumper.
You can run it manually using this command:
./build/premix debug*.json
Persist
Because the Nimbus P2P layer still contains bugs, you may become impatient when
trying to sync blocks. In the ./premix directory, you can find a persist
tool. It will help you sync relatively quicker because it will bypass the P2P
layer and download blocks from geth via rpc-api.
When it encounters a problematic block during syncing, it will stop and produce debugging data just like Nimbus does.
./build/persist [--dataDir:your_database_directory] [--head: blockNumber] [--maxBlocks: number] [--numCommits: number]
Debug
In the same ./premix directory you'll find the debug tool that you can use
to process previously generated debugging info in order to work with one block
and one transaction at a time instead of multiple confusing blocks and
transactions.
./build/debug block*.json
where block*.json contains the database snapshot needed to debug a single
block produced by the Premix tool.
Dumper
Dumper was designed specifically to produce debugging data that can be further processed by Premix from information already stored in database. It will create tracing information for a single block if that block has been already persisted.
If you want to generate debugging data, it's better to use the Persist tool. The data generated by Dumper is usually used to debug Premix features in general and the report page logic in particular.
# usage:
./build/dumper [--datadir:your_path] --head:blockNumber
Hunter
Hunter's purpose is to track down problematic blocks and create debugging info associated with them. It will not access your on-disk database, because it has its own prestate construction code.
Hunter will download all it needs from geth, just make sure your geth version is at least 1.8.18.
Hunter depends on
eth_getProof(EIP1186). Make
sure your installed geth supports this functionality (older versions don't
have this implemented).
# usage:
./build/hunter --head:blockNumber --maxBlocks:number
blockNumber is the starting block where the hunt begins.
maxBlocks is the number of problematic blocks you want to capture before
stopping the hunt.
Regress
Regress is an offline block validation tool. It will not download block information from anywhere like Persist tool. Regress will validate your already persisted block in database. It will try to find any regression introduced either by bugfixing or refactoring.
# usage:
./build/regress [--dataDir:your_db_path] --head:blockNumber
